Flag Pattern vs Pennant Pattern: Key Differences and How to Trade Each

Flag patterns and pennant patterns are two of the most common continuation patterns in technical analysis. Both appear after a strong price move and suggest that the market is pausing before continuing in the same direction. Because they form in similar situations, are short-term chart patterns, and often produce similar breakout moves, many traders confuse the two.
However, while the market psychology behind both patterns is similar, the structure of the consolidation phase is different. Understanding these differences helps traders identify the pattern correctly and avoid misinterpreting price action.
What Is a Flag Pattern?
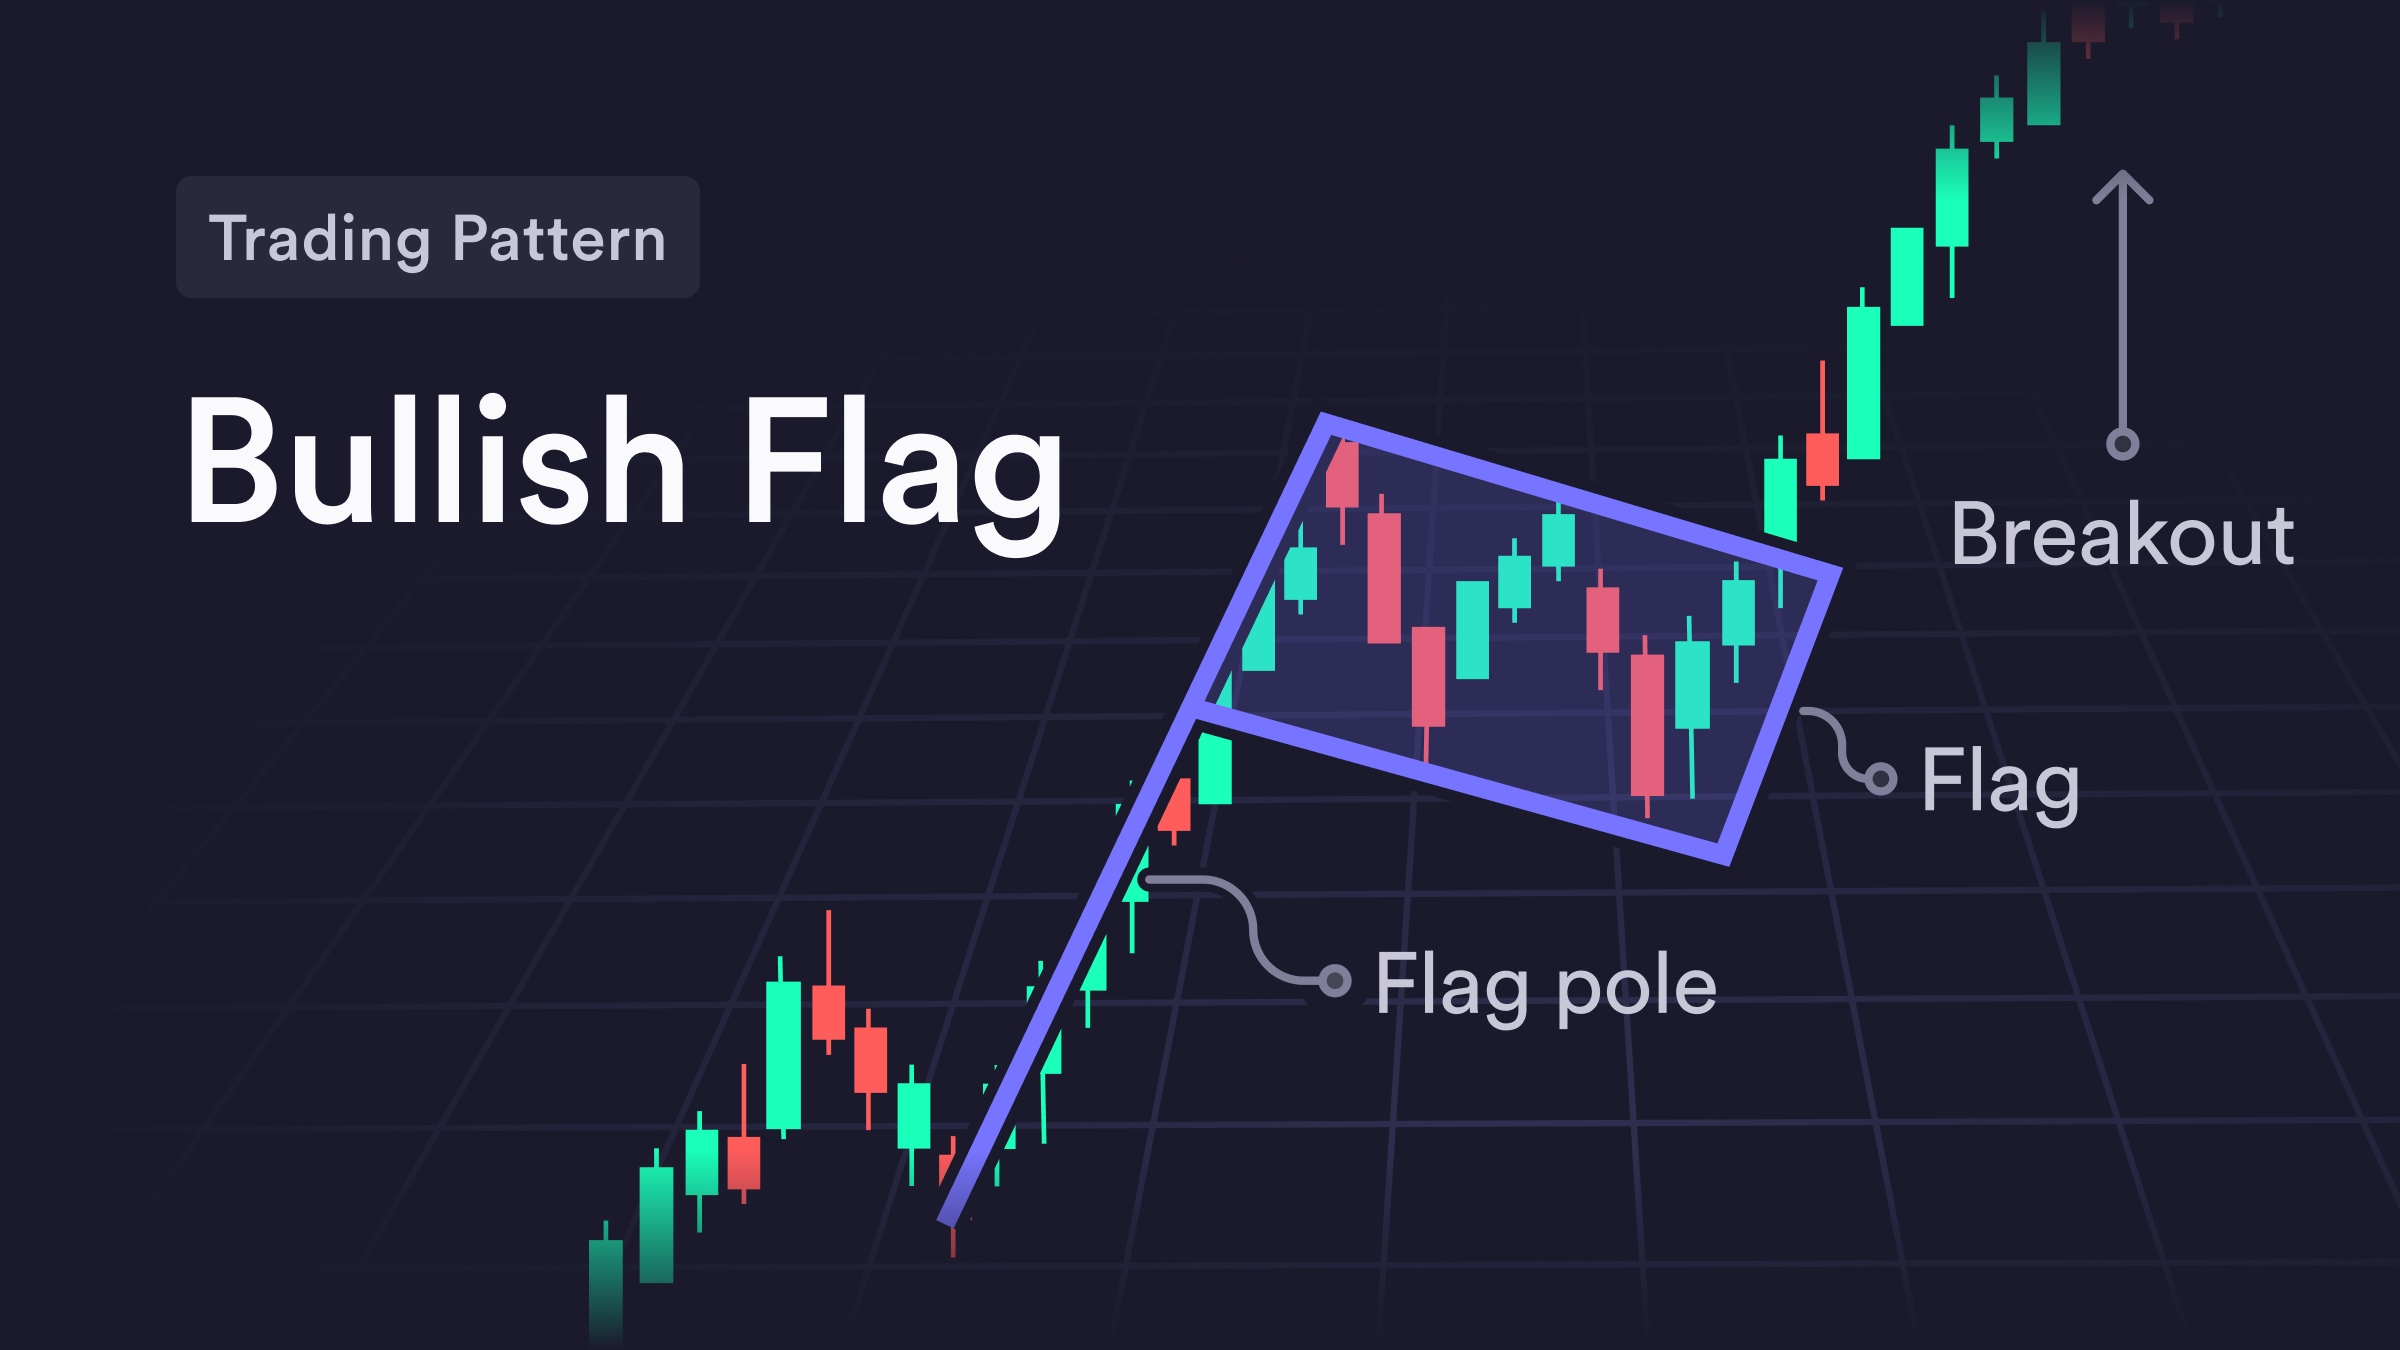
A flag pattern is a continuation pattern that forms after a strong price move known as the flagpole. After the flagpole forms, price consolidates within a parallel channel that slopes slightly against the trend. The structure resembles a flag attached to a pole and comprises:
- Flagpole: A strong upward or downward move
- Consolidation channel: Price drifts within two parallel lines, usually sloping against the trend
- Breakout: Price resumes the original trend direction
In a bullish flag, price surges upward and then drifts slightly downward in a tight channel before breaking higher. In a bearish flag, price drops sharply and then consolidates in a small upward channel before breaking lower. The key feature of a flag pattern is that the consolidation occurs inside two parallel trendlines.
The psychology behind the flag pattern is that the flag represents a pause in the market. After a strong move, early participants take profits while new traders enter positions. This tug-of-war creates a temporary balance between buyers and sellers. Once the consolidation ends, the dominant side — buyers in a bull flag, sellers in a bear flag — regains control, driving the breakout.
What Is a Pennant Pattern?
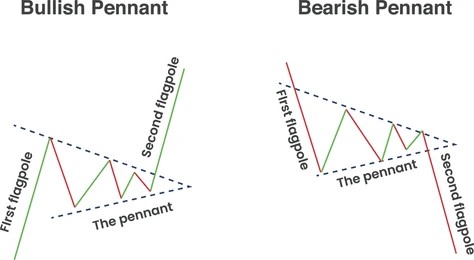
A pennant pattern is also a continuation pattern that appears after a strong price move. Instead of forming a parallel channel, the consolidation phase forms a small symmetrical triangle. The pattern looks like a small pennant attached to a flagpole, which is where the name comes from. The pennant pattern comprises:
- Flagpole: A strong price movement
- Triangle consolidation: Price range tightens — highs become lower, lows become higher, and the price compresses toward an apex. The tightening structure indicates that the market is building pressure before a breakout.
- Breakout: Continuation in the original direction
One practical difference from the flag is that the breakout level on a pennant changes as the pattern develops. Because the upper trendline is converging downward toward the price, the trigger level gets lower as the consolidation progresses. You need to update your trendlines as the pattern forms rather than setting a static alert at the start.
The psychology behind the pennant pattern is that the pennant reflects a buildup of pressure. After a sharp move, traders pause, creating a narrowing range as buyers and sellers battle for control. This compression signals indecision but also energy accumulation. When the breakout occurs, it often unleashes strong momentum in the direction of the prior trend.
Flag vs. Pennant — The Actual Difference
Both patterns begin with the flagpole — a sharp, directional move on high volume. At this stage, you cannot tell whether the consolidation will form a flag or a pennant. The distinction only emerges in the consolidation phase. The structural difference is:
- Flag: Consolidation occurs inside two parallel trendlines, forming a rectangular channel that maintains a consistent width.
- Pennant: Consolidation occurs inside two converging trendlines, forming a small symmetrical triangle that narrows toward an apex.
In both patterns, volume typically declines during consolidation. On breakout, volume expands again. No volume clue distinguishes a flag from a pennant.
The measured move target is also the same. Both patterns use the flagpole length as the basis for the price target. You measure the height of the flagpole and add it to the breakout point on bullish patterns, or subtract it from bearish ones. The consolidation shape does not affect the calculation.
Market Psychology:
- Both patterns reflect trader behavior after sharp moves: profit-taking, hesitation, and new entries.
- They reveal sentiment: bullish flags and pennants show confidence in continued gains, while bearish versions highlight persistent pessimism.
- They help traders identify entry points with favorable risk-to-reward ratios, since breakouts often lead to strong continuation moves.
RELATED READ: Best Chart Pattern Recognition Software for Stock Trading in 2026
How Traders Trade Flag and Pennant Patterns
Because flag and pennant patterns are continuation setups, traders typically use them to join an existing trend rather than predict a reversal. The idea is simple: a strong move creates momentum (the flagpole), the market pauses briefly (the flag or pennant), and then the price often resumes moving in the original direction.
Most traders focus on breakout strategies, waiting for the price to leave the consolidation zone before entering a trade.
Entry Strategy
The most common entry occurs when the price breaks out of the consolidation structure.
- Bullish flag or pennant: Enter when price breaks above the upper resistance line of the pattern.
- Bearish flag or pennant: Enter when price breaks below the lower support line of the pattern.
Avoid entering the moment price touches the boundary. Instead, wait for confirmation such as:
- A strong breakout candle closing outside the pattern
- Higher trading volume during the breakout
- The next candle continuing in the breakout direction
Waiting for confirmation helps reduce the risk of false breakouts, which are common in consolidation patterns.
Stop-Loss Placement
Risk management is critical when trading continuation patterns. Common stop-loss placements include:
- Below the lower boundary of the pattern for bullish setups
- Above the upper boundary of the pattern for bearish setups
This placement works because the consolidation area acts as a temporary support or resistance zone. If price moves back through that zone after the breakout, it usually means the pattern has failed.
Profit Targets
Many traders use the measured move method to estimate potential profit targets. The concept is straightforward:
- Measure the height of the flagpole (the strong move before consolidation).
- Project that same distance from the breakout point.
For example, if the flagpole represents a $10 move, traders often project a $10 target from the breakout level. While price does not always reach the exact measured move, this technique provides a reasonable estimate for potential upside or downside.
Always watch for false breakouts and wait for confirmation. Not every flag or pennant leads to a successful continuation. A breakout candle whose high is never exceeded by the following candle lacks confirmation — use indicators like RSI to check whether the market is already overbought. These signals together suggest the breakout was weak and that entering the trade should be avoided.
RELATED READ: 10 Common Chart Pattern Mistakes Traders Must Avoid in 2026
Conclusion
Flag patterns and pennant patterns are both powerful continuation signals that appear during strong trends. While their consolidation structures differ, the market psychology behind them is nearly identical. Both patterns represent a temporary pause where traders reassess positions before momentum returns to the market. For traders, recognizing these formations can help identify potential breakout opportunities.
While no chart pattern is perfectly reliable, flags and pennants remain valuable tools in technical analysis. When used together with volume analysis, trend confirmation, and broader market context, they can significantly improve decision-making for both day traders and swing traders.
RELATED READ: Best Chart Patterns for Day Trading in 2026 (With Examples & Trading Tips)
Chart Patterns · Flag Pattern · Pennant Pattern · Breakout Trading · Technical Analysis · Day Trading · Continuation Patterns
Frequently Asked Questions
What is the simplest way to tell a flag from a pennant?
Look at the consolidation boundaries. If they are parallel, it is a flag. If they are converging toward a point, it is a pennant. That is the only structural difference between the two patterns.
Do flags and pennants have the same price target?
Yes. Both use the same measured move calculation — the flagpole height added to the breakout point for bullish patterns and subtracted from the breakdown point for bearish patterns.
Which pattern is more reliable?
Neither is meaningfully more reliable than the other when traded correctly. What matters most is the strength of the flagpole and the volume on the breakout, not the shape of the consolidation.
What volume confirms a flag or pennant breakout?
A minimum of 2x Relative Volume on the breakout candle. Above 3x is ideal on individual momentum stocks. The breakout volume should be visibly higher than the declining volume seen during the consolidation.
What is the difference between a pennant and a symmetrical triangle?
Both have converging trendlines forming a triangle shape, but the context is different. A pennant requires a strong directional flagpole immediately before the triangle, making it a continuation pattern with a clear directional bias. A symmetrical triangle forms without that flagpole context and can break in either direction. The flagpole is what makes a pennant a pennant.
Can a flag turn into a pennant?
Yes. A consolidation can start with parallel-looking trendlines and gradually develop convergence as it progresses. When this happens, update your trendlines and adjust your alert level. The transition does not invalidate the setup — it just means you need to redraw the boundaries to reflect what the pattern is actually doing.