Bollinger Bands Explained: What They Are and How They Work

Markets rarely move in a straight line. They expand, contract, trend, pause, and then move again. For traders, Bollinger Bands help them read market behavior in real time.
Bollinger Bands are one of the most widely used indicators in technical analysis because they visually show when the price is stretched, when volatility is expanding, and when the market is coiling for a breakout. Instead of guessing whether a move is overextended or whether a consolidation might explode into momentum, the bands give traders a structured way to see it on the chart.
In this guide, you'll learn exactly how Bollinger Bands work, how traders interpret them in real markets, and the most effective settings for using them in day trading and swing trading.
What Are Bollinger Bands?
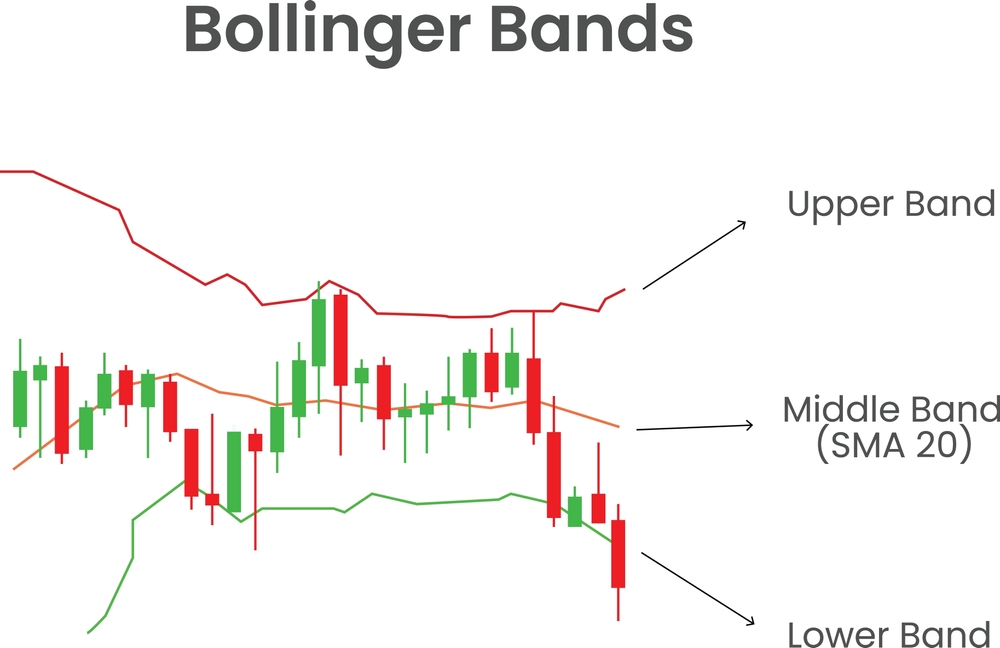
Bollinger Bands are a popular technical indicator that measures market volatility. The indicator consists of three lines plotted directly on the price chart:
- Middle Band: A simple moving average of closing prices, typically calculated over 20 periods
- Upper Band: Plotted two standard deviations above the middle band
- Lower Band: Plotted two standard deviations below the middle band
Together, they form a dynamic channel that expands when volatility rises and contracts when volatility falls, helping traders see when the price is relatively high or low compared to its recent average. Unlike fixed support and resistance levels, Bollinger Bands automatically adjust as market conditions change.
The indicator was developed in the 1980s by John Bollinger, who wanted to combine moving averages with volatility into a single tool. By using standard deviation to define the width of the bands, he created a system that adapts to shifting market environments rather than relying on static ranges. Since then, Bollinger Bands have become a staple of technical analysis and are available on virtually every trading platform, from MetaTrader to TradingView.
How Bollinger Bands Work
To understand Bollinger Bands, it's essential to grasp the role of standard deviation, which measures how far prices typically move from their average. When price swings grow larger, standard deviation rises; when price action becomes quiet and stable, it falls. Because the upper and lower bands are built on this measure, they automatically adjust to market conditions — expanding during periods of high volatility and contracting when volatility decreases.
This dynamic behavior makes Bollinger Bands valuable: they visually highlight whether the market is calm or gearing up for explosive movement. Price usually remains within the bands, and when it pushes toward the edges, it often signals that price is stretched relative to its average.
However, this doesn't guarantee a reversal. A common mistake traders make is assuming that touching the upper band means "overbought" or that every bounce from the lower band is a buying opportunity. In reality, Bollinger Bands are best understood as a tool for analyzing volatility and market structure, not as simple buy-or-sell signals.
How to Calculate Bollinger Bands
Understanding how to calculate Bollinger Bands is what separates traders who use them correctly from those who misinterpret them. The process is straightforward:
- Middle Band (SMA): Calculate the 20-period simple moving average of closing prices. This is the central line.
- Standard Deviation: Measure how far each closing price deviates from the SMA. Larger swings mean higher standard deviation; smaller swings mean lower.
- Upper and Lower Bands:
- Upper Band = SMA + (2 × Standard Deviation)
- Lower Band = SMA − (2 × Standard Deviation)
The use of two standard deviations is deliberate. Statistically, it captures about 95% of price action in a normally distributed dataset, meaning most closes should fall within the bands. A close outside the bands is therefore significant, not routine noise.
Bandwidth expresses the gap between the bands as a percentage of the SMA:
Bandwidth = (Upper Band − Lower Band) ÷ Middle Band × 100
Rising bandwidth signals expanding volatility, while falling bandwidth shows contraction. When bandwidth reaches extreme lows, the market is often coiling for a breakout.
RELATED READ: How to Use Fibonacci Retracement Levels for High-Probability Trade Setups
Best Bollinger Bands Settings
Bollinger Bands are built on three key parameters: period length, standard deviation multiplier, and moving average type. The default settings — a 20-period simple moving average with bands at 2 standard deviations — are widely used because they balance responsiveness with stability across most markets and timeframes.
Period (Default: 20)
The period determines both the length of the moving average and the number of data points used to calculate the standard deviation.
- Shorter periods (10–14): Bands react quickly to price changes, producing more signals but also more noise. Useful for scalping or very short-term trading.
- Longer periods (30–50+): Bands smooth out volatility, generating fewer but more reliable signals. Better suited for swing or position trading.
Standard Deviations (Default: 2)
The multiplier sets the distance of the bands from the middle moving average. Two standard deviations is the universal standard and captures 95% of price action, making closes outside the bands statistically significant.
- Wider bands (2.5–3): Reduce false signals in highly volatile markets. Band penetrations become rarer and more meaningful.
- Narrower bands (1.5): Increase frequency of band touches but reduce reliability. Rarely recommended except for specialized strategies.
Moving Average Type (Default: SMA)
The Simple Moving Average (SMA) is the original design and most widely used. Institutional traders and platforms rely on it, giving it self-fulfilling importance. The Exponential Moving Average (EMA) reacts faster to recent price changes and is preferred by some intraday traders for quicker signals.
Settings by Trading Style
Scalping (1–5 minute charts)
- Period: 10–12 | Standard Deviations: 2 | MA Type: SMA or EMA
- Expect frequent band touches, more signals, and more noise. Requires strict confirmation tools (RSI, volume).
Day Trading (5–15 minute charts)
- Period: 20 | Standard Deviations: 2 | MA Type: SMA
- Balanced volatility view and reliable setups (squeeze, breakout, reversal). The middle band acts as dynamic support/resistance.
Swing Trading (Daily charts)
- Period: 20–50 | Standard Deviations: 2 | MA Type: SMA
- Smoother bands that filter intraday noise. Signals represent multi-day or multi-week moves.
Position Trading (Weekly charts)
- Period: 50+ | Standard Deviations: 2–2.5 | MA Type: SMA
- Very few signals, but highly significant. Weekly squeezes often precede major long-term market moves.
The 20-period, 2 standard deviation SMA remains the gold standard for most traders. Scalpers shorten the period for speed; swing and position traders lengthen it for reliability. Bollinger Bands work best combined with RSI and VWAP — relying on the indicator alone can lead to false signals.
RELATED READ: What Timeframe Do Day Traders Use? Best Trading Timeframes 2026
How to Test Your Settings Before Going Live
Changing Bollinger Bands settings without testing them is optimization without validation. Here is a practical process for confirming that a settings change actually improves your analysis before trading real capital on it.
- Define what you are trying to improve: Be specific about the problem before changing settings. Vague goals produce meaningless tests.
- Change one parameter at a time: If you adjust both the period and the standard deviation simultaneously, you cannot isolate which change produced which result. Adjust one, observe the effect, then decide whether a second adjustment is warranted.
- Test on historical data first: On TradingView, scroll back through at least 50–100 trading sessions on your preferred timeframe with the new settings applied. Count how many band touches produced meaningful reversals versus how many immediately continued. Compare this to the default settings on the same historical period.
- Paper trade the new settings: Before risking real capital, apply the new settings in a paper trading environment for at least two to four weeks across a range of market conditions (trending, ranging, and volatile). If the settings improve your signal quality in live conditions, proceed. If not, revert to the defaults.
Conclusion
Bollinger Bands remain one of the most practical indicators for understanding how price behaves in real market conditions. By combining a moving average with standard deviation, the indicator adapts to changing volatility and shows traders when the price is expanding, contracting, or potentially preparing for a breakout.
The default 20-period, 2 standard deviation setting remains effective across most markets and timeframes, but traders should always test adjustments before applying them in live trading. Small changes to the period or deviation multiplier can significantly alter how the bands respond to price movement.
Most importantly, Bollinger Bands should be used alongside other tools — RSI, VWAP, price action, and volume analysis — to confirm trading setups and avoid false signals. When combined with disciplined risk management and proper confirmation, they can become a powerful component of a structured trading strategy.
Technical Analysis · Bollinger Bands · Volatility · Trading Indicators · Day Trading · Swing Trading
Frequently Asked Questions
Should I change Bollinger Bands settings for different stocks?
For most liquid stocks, the default settings work consistently. The main situation where adjustment is warranted is on extremely high-volatility instruments like low-float momentum stocks or highly volatile crypto assets, where the default 2 standard deviation setting produces too many band penetrations to be meaningful. In those cases, increasing to 2.5 or 3 standard deviations restores statistical significance to band extremes.
Is 2.5 standard deviations better than 2?
Not universally. Two standard deviations capture approximately 95% of normal price action. Increasing to 2.5 captures approximately 98.8%, making band touches rarer and potentially more significant. Whether this is better depends on the instrument's baseline volatility. On standard large-cap stocks, 2 is optimal. On high-volatility assets, 2.5 may be more appropriate.
What is the best Bollinger Bands setting for crypto?
For Bitcoin and Ethereum during normal volatility conditions, the default 20-period, 2 standard deviation setting works acceptably. During high-volatility periods or for altcoins with higher baseline volatility, consider 20 period with 2.5 standard deviations. On swing trading timeframes, a 20–50 period with 2.5 standard deviations tends to produce cleaner signals by filtering extreme short-term noise.
Why do my Bollinger Bands look different on TradingView vs Thinkorswim?
Minor visual differences between platforms are normal and typically result from slightly different calculation implementations — specifically how each platform handles the standard deviation calculation and whether it uses population or sample standard deviation. The differences are usually small and do not meaningfully affect the analytical value of the bands.
Can I add a second set of Bollinger Bands to my chart?
Yes, and many experienced traders do. A common approach is to plot two sets — one at 2 standard deviations and one at 1 standard deviation. The inner bands at 1 standard deviation capture approximately 68% of normal price action and can be used as dynamic support and resistance zones within the wider channel. On TradingView, simply add the Bollinger Bands indicator twice with different standard deviation settings.