What Is VWAP in Trading? Meaning, Formula, and How to Use It
Learn what VWAP means in trading, how it's calculated, and how traders use it to find better entry and exit points.

Introduction
The VWAP indicator stands for Volume-Weighted Average Price, and it's one of the most trusted tools among day traders and institutional investors alike.
In simple terms, VWAP helps traders see whether they're getting a good deal, buying below or selling above the day's average trading price. With the rise of retail trading and easy-to-use platforms like Robinhood and Webull, more people are paying attention to technical indicators such as VWAP.
In this article, we'll break down what VWAP means, how it works, why traders use it, and how you can apply it to your own trading strategy, even if you're just starting.
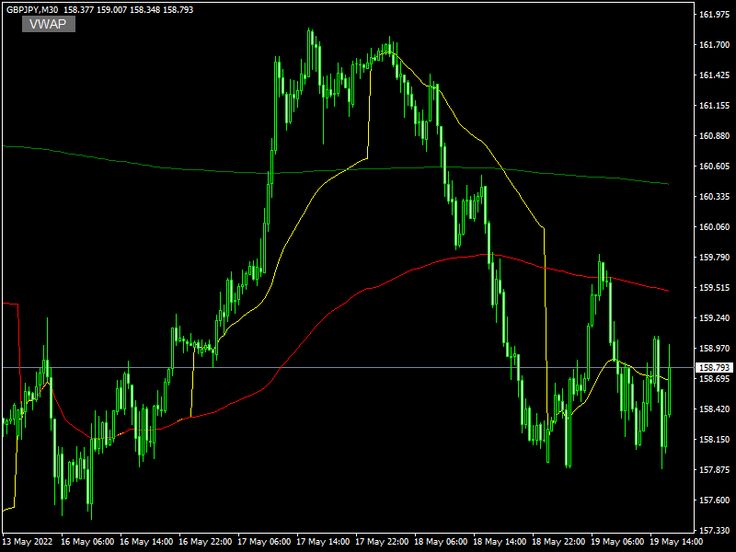
What Is VWAP in Trading?
VWAP stands for Volume-Weighted Average Price and refers to the average price a financial asset has traded throughout the day, based on both volume and price. It is a balance point that shows you where most trading activity has happened during the day.
When a stock's current price is above VWAP, it means buyers are more active and the trend might be bullish. If it's below VWAP, sellers are dominating, and the stock could be under pressure. Traders often use VWAP to decide if they're entering or exiting trades at a good level compared to the overall market sentiment.
Traders calculate VWAP by totaling the price for every transaction and then dividing it by the total number of shares traded. A simple formula for this is:
VWAP = (Cumulative Price × Volume) ÷ Total Volume
Here's the simple idea: VWAP multiplies each price by the volume traded at that price, then divides by the total volume for the day. This means it gives more weight to prices where more shares were traded.
How to Calculate VWAP in Trading
To calculate VWAP manually, start by finding the average price of a stock over a given time period. You want to calculate the first five minutes of the trading day:
- First, add the high, low, and close prices for the day.
- Divide the result by three to get the average price.
- Multiply the average price by the trading volume for that period to get the Price × Volume (PV) value. For example, if a stock's high, low, and close are $105, $100, and $103, respectively, the average price is $102.67. If 10,000 shares were traded, the PV would be $1,026,700.
- Next, divide the PV by the volume to get the VWAP for that period, in this case, $102.67.
To maintain an updated VWAP throughout the trading day, keep adding each new period's PV to the previous total PV, and divide by the total cumulative volume up to that point. This ongoing calculation provides traders with a real-time view of the average price, weighted by trading activity, helping them understand whether the stock is trading above or below its true intraday average.
However, you don't need to calculate it manually; most trading platforms like TradingView, ThinkorSwim, or Robinhood display it automatically on charts as a single line that updates in real time.
More: The STRAT Trading Strategy Explained: A Step-by-Step Guide for Day Traders
How to Use VWAP in Trading
VWAP helps traders make smarter decisions by showing where the "fair value" of a stock lies for that trading day.
Here's how it's commonly used:
- Buy signals: When the price crosses above VWAP, it can suggest upward momentum, giving traders a buying opportunity. Traders use this opportunity to enter a trade when the price is above the VWAP line.
- Sell signals: When the price falls below VWAP, it can hint at bearish momentum, and traders see this as a potential selling point.
- Exit Signal: Use the VWAP formula to know when to exit a trade. Place your stop loss slightly below the latest swing low for long positions, or just above the most recent swing high for short positions. As the trade moves in your favor, you can trail the stop loss to secure some profits along the way.
NB: When using the VWAP indicator, it's also smart to set a realistic take-profit target based on nearby support or resistance zones, or around previous price swing levels. This helps you manage risk while maximizing potential returns.
Pros and Cons of VWAP in Trading
Pros:
- This indicator combines price and volume, giving a more accurate reflection of market activity.
- Acts as a strong benchmark for trade performance, helping traders see if they bought or sold at a good price.
- Works well for day trading and quick decisions, especially when used with real-time volume data.
- Helps identify high-volume trading zones, which can act as key support or resistance areas.
Cons:
- Not useful for long-term investing since it resets daily.
- Can lag behind fast-moving prices in volatile markets or during sudden spikes in trading volume.
- Some traders misuse VWAP as a standalone signal rather than combining it with other indicators like RSI or MACD.
More: 3 Main Types of Price Charts in Trading (And How to Read Them Like a Pro)
Who Should Use VWAP?
VWAP is ideal for day traders, short-term investors, and anyone learning technical analysis. It helps you stay disciplined and make decisions based on data, not emotions.
However, it's not the best fit for long-term investors or swing traders, since VWAP resets every day and doesn't capture longer market trends.
VWAP Trading Strategies
Here are some ways traders employ VWAP strategically to maximize profits:
VWAP Pullback Strategy
Traders wait for the price to move above VWAP, confirming bullish momentum, then buy when it pulls back close to VWAP before bouncing higher.
VWAP Breakout Strategy
Traders place their trade when the price breaks decisively above or below VWAP after consolidation, signaling a strong move in that direction.
VWAP + RSI or MACD Combo
Use VWAP with momentum indicators to confirm entry and exit signals for higher accuracy.
Conclusion
Overall, VWAP is one of those simple yet powerful indicators that help traders understand where the market truly values a stock during the day. It helps traders buy low, sell high, and gauge fair price levels with greater confidence. However, like any tool, VWAP works best when paired with other indicators and a solid trading plan. It reflects the average price, not future movements. In the end, VWAP can make your trading decisions smarter, but remember to combine this with knowledge, patience, and effective risk management while trading.
To use VWAP effectively, traders should combine it with volume, trend, and support/resistance analysis rather than relying on it alone. Avoid chasing prices that move too far from VWAP; instead, wait for retracements to find better entry points.
Related Read: 15 Proven Day Trading Strategies For A Profitable Trade
Frequently Asked Questions
What does VWAP mean in trading?
▼
VWAP stands for Volume-Weighted Average Price. It shows the average price a stock traded at throughout the day, factoring in both price and volume.
How is VWAP different from a moving average?
▼
VWAP includes trading volume in its calculation and resets daily, while moving averages only consider price and extend over multiple days.
Can VWAP be used for long-term investing?
▼
Not really. VWAP is meant for daily trade analysis. It usually resets every trading day, so it's less effective for longer-term trades.
Is VWAP good for beginners?
▼
Yes. It's one of the simplest indicators to understand and visualize. Just remember to combine it with other tools for the best results.
VWAP Technical Analysis Trading Indicators Day Trading Volume Analysis Trading Strategies
Frequently Asked Questions
What does VWAP mean in trading?
VWAP stands for Volume-Weighted Average Price. It shows the average price a stock traded at throughout the day, factoring in both price and volume.
How is VWAP different from a moving average?
VWAP includes trading volume in its calculation and resets daily, while moving averages only consider price and extend over multiple days.
Can VWAP be used for long-term investing?
Not really. VWAP is meant for daily trade analysis. It usually resets every trading day, so it's less effective for longer-term trades.
Is VWAP good for beginners?
Yes. It's one of the simplest indicators to understand and visualize. Just remember to combine it with other tools for the best results.