


Reversal patterns play a crucial role in trading as they help traders identify potential turning points in the market. Instead of chasing price after a move has already happened, reversal patterns allow traders to prepare for a possible shift in trend. One of the most well-known and widely used bullish reversal patterns is the double bottom. When identified correctly and confirmed properly, the double bottom can signal that selling pressure is weakening and buyers may be stepping in. However, like all chart patterns, it is not enough to simply spot the shape; confirmation is what separates reliable setups from false signals.
What Is the Double Bottom Pattern?
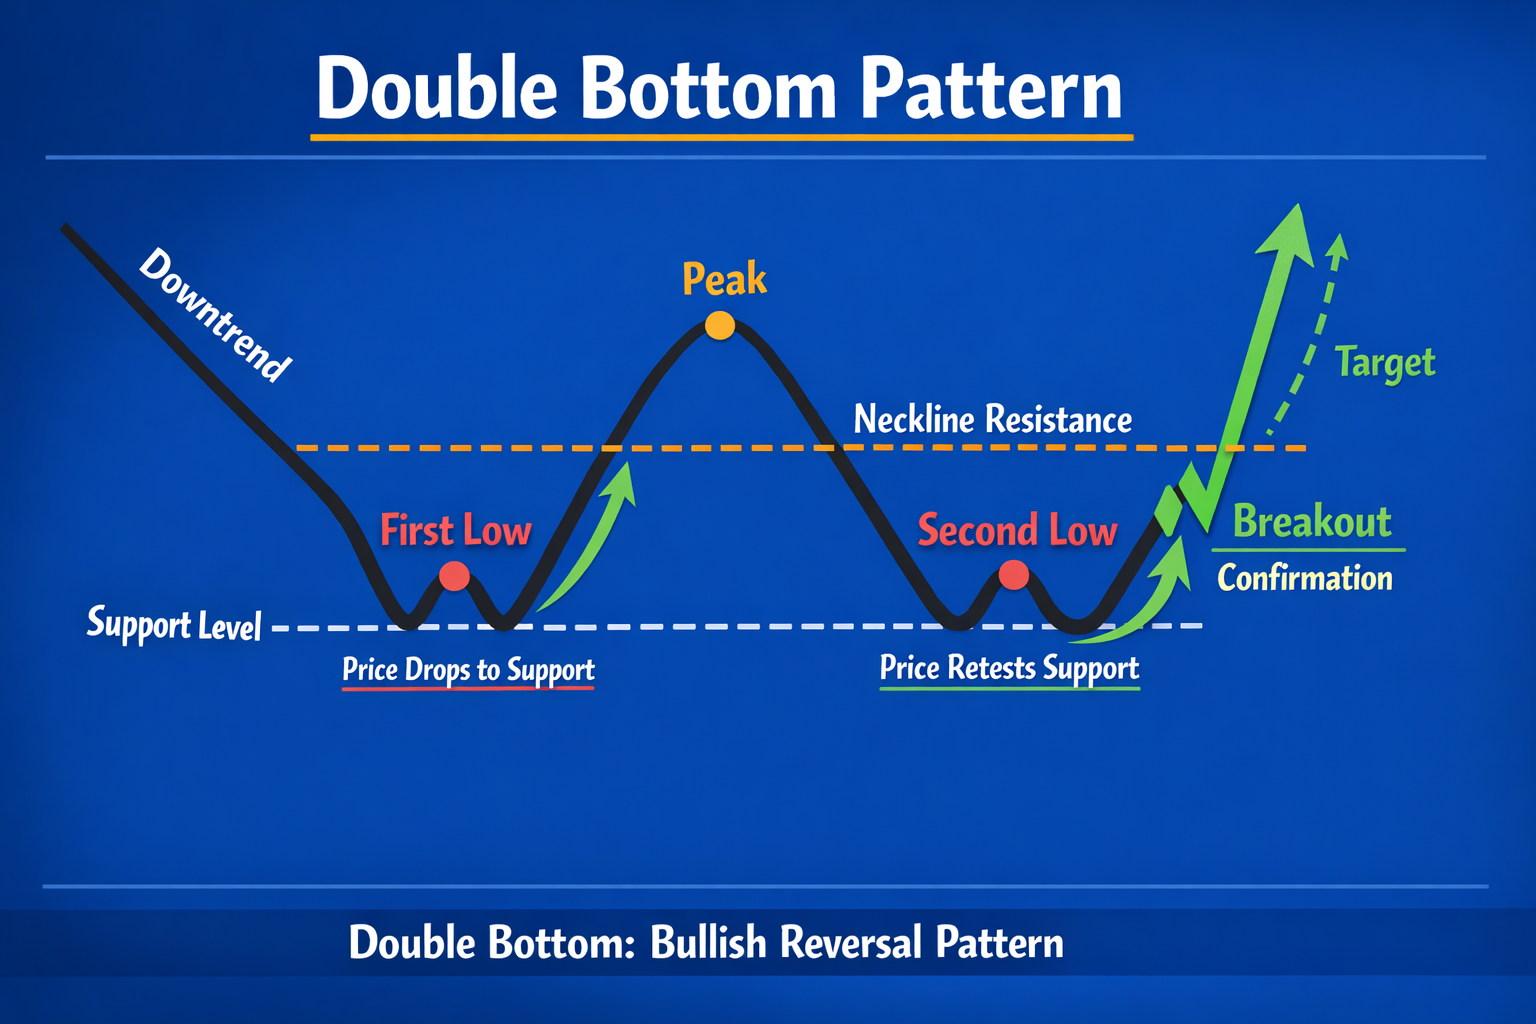
The double bottom pattern is a bullish reversal chart pattern that typically forms after a sustained downtrend. It signals that the price has tested a key support level twice and failed to break lower, suggesting that selling momentum is losing strength.
Visually, the pattern resembles a "W" shape on the chart. The first bottom forms after a strong selloff, followed by a temporary rebound. Price then drops again to roughly the same level as the first bottom, but instead of continuing lower, it stabilizes and starts to move higher. This second failure to push lower is what gives the pattern its bullish significance.
The double bottom should always be viewed in trend context. It is most meaningful when it appears after a clear downtrend, as it represents a potential transition from bearish to bullish market conditions. Without a preceding downtrend, the pattern loses much of its predictive value.
The psychology of the double bottom reflects a gradual shift from bearish to bullish sentiment. During the first bottom, fear dominates the market as sellers aggressively push prices lower. By the second bottom, that fear begins to fade. Sellers are less aggressive, and buyers become more willing to step in at the same support level.
As price holds and starts to move higher, confidence grows among buyers, while sellers begin to exit or cover their positions. This shift from fear to accumulation is what ultimately fuels the breakout and potential trend reversal.
How the Double Bottom Pattern Forms
The double bottom pattern develops in a series of distinct stages, each reflecting a gradual shift in market control.
- Downtrend: First, there must be a prior downtrend. Price has been moving lower consistently, showing that sellers are in control. The pattern begins with the first bottom, which often forms during a period of panic selling as traders rush to exit losing positions.
- First bottom (panic selling): The pattern begins with a sharp decline, often driven by fear and panic as traders rush to exit losing positions.
- Temporary bounce (relief rally): Buyers step in at support, causing a short-term bounce, but the move lacks enough strength to fully reverse the downtrend.
- Second bottom (weakening sellers): Price returns to the same support area, but selling pressure is noticeably weaker. Instead of breaking lower, the price stabilizes, signaling that bearish momentum is fading.
- Neckline formation: A resistance level forms at the high of the relief rally between the two bottoms.
- Breakout confirmation: The pattern is confirmed when the price breaks above the neckline, ideally with increased volume, signaling a potential bullish reversal.
To spot the double bottom chart pattern, look for the price dropping twice to about the same level with a bounce in between. The first dip usually follows a strong downward trend, signaling that sellers are losing strength. After this, the price rebounds and reaches a peak, which acts as a resistance line that the price struggles to break. The price then falls again but finds support at the same level as the first dip, forming the second bottom. The pattern is confirmed when the price finally breaks above the resistance line, also called the neckline. In simple terms, it's like the market testing the same low point twice, failing to go lower, and then pushing upward once it breaks through the barrier at the top.
Read More: Cup and Handle Pattern: How It Works and How to Trade It (2025 Guide)
Is the Double Bottom Pattern a Good Signal?
Yes, the double bottom can be a strong signal for buying, but only if it's identified correctly. If misread, it can lead to losses, so patience and caution are important.
- Aggressive traders may enter when the price forms the second low.
- Conservative traders usually wait until the price breaks above the neckline (the resistance level).
- High-risk traders might buy small amounts if they see bullish reversal candlesticks forming near the second low, but they must use a strict stop loss just below the support level.
How to Trade the Double Bottom Pattern
Here is a step-by-step approach to trading the double bottom pattern:
- Spot the pattern: Look for a strong downtrend followed by two lows at about the same level, with a bounce in between.
- Confirm it: Make sure the price breaks above the neckline (the resistance line between the two lows).
- Enter the trade: A common approach is to buy once the price breaks above the neckline after confirmation.
- Set a stop loss: Place it just below the second low or the breakout level to protect against losses.
- Set a target price: Measure the distance between the neckline and the bottom, then add that distance to the breakout point to estimate your profit target.
You can trade it using these strategies:
- Breakout trade: Enter when the price breaks above the neckline.
- Retest trade: Enter when the price comes back to test the neckline and holds above it.
In short, the double bottom is often seen as a bullish signal in forex and stock markets. But success depends on careful confirmation, smart risk management, and awareness of the broader market trend.
Indicators That Confirm a Double Bottom
A double bottom is more reliable when paired with confirming signals rather than traded on shape alone:
- Volume increase on breakout: Price should break above the neckline with rising volume to confirm buying interest.
- RSI bullish divergence: If RSI forms higher lows while price tests the second bottom, it indicates weakening selling momentum.
- Moving average support: Price holding above short-term or medium-term moving averages during the bounce adds confidence.
- Support confirmation: The two bottoms should test the same support area, showing that sellers are losing control.
Read more: Head and Shoulders Chart Pattern: How to Trade (2025 Guide)
Pros and Cons of the Double Bottom Pattern
Pros:
- Signals a reversal: Suggests a shift from a downtrend to an uptrend, hinting the market may be turning.
- Confirms strong support: Testing the same low twice shows buyers are stepping in at that level.
- Indicates bullish momentum: Breaking above resistance after the second bottom shows buyers gaining control.
- Provides clear entry points: The neckline breakout offers a defined level to enter long trades.
- Supports risk management: Traders can place stop-loss orders just below the second bottom to limit losses.
- Strong reversal pattern: Widely considered one of the most reliable patterns for predicting trend changes.
- Defined levels to trade against: Offers clear support and resistance zones for planning trades.
Cons:
- Contrarian nature: The pattern goes against the prevailing downtrend, which can be risky if the trend continues.
- False signals: Not every double bottom leads to a bullish reversal; some fail.
- Subjective recognition: Traders may interpret the pattern differently, leading to inconsistent results.
- No precise timing: The pattern doesn't tell you exactly when to enter or exit.
- Market context matters: Must be analyzed alongside broader market conditions and other indicators.
- Overlapping patterns: Sometimes part of a larger, more complex formation, which can make interpretation tricky.
Common mistakes traders make when using the double bottom pattern include buying before the neckline breakout, which increases the risk of failed setups, and ignoring the higher timeframe trend, since a double bottom within a strong downtrend may fail even if the W-shape looks clean. Another common error is overleveraging trades, as using too much margin can magnify losses if the breakout does not hold. Finally, trading low-volume setups can be risky because weak volume often leads to false breakouts that don't sustain momentum.
The double bottom is powerful because it offers clear signals and risk management levels, but it's not foolproof. Success depends on careful confirmation, patience, and considering the bigger market picture.
Double Bottom vs Adam and Eve Bottom
The double bottom and Adam and Eve bottom sounds identical, but here are what makes them different:
| Feature | Double Bottom | Adam and Eve Bottom |
|---|---|---|
| Structure | Two sharp dips forming a clear W-shape | One sharp "Adam" dip followed by a smoother, rounded "Eve" dip |
| Reliability | Strong bullish reversal, but it can give false signals if misread | Often seen as more psychologically convincing due to the rounded Eve bottom |
| Timing of Signal | Can trigger an earlier breakout once the neckline is broken | Requires the Eve bottom to fully form, so confirmation comes later |
| Trader Insight | Faster but riskier entry opportunities | Slower, more cautious setup with potentially stronger confirmation. |
Both are bullish reversal patterns, but the Double Bottom is sharper and quicker, while the Adam and Eve Bottom is smoother and slower to confirm.
Conclusion
The double bottom pattern remains one of the most reliable bullish reversal structures because it reflects a clear shift in market psychology. Sellers attempt to push the price lower twice and fail both times, while buyers gradually gain confidence and step in at the same support level. However, the real edge does not come from recognizing the "W" shape alone, but from waiting for confirmation through a neckline breakout, volume expansion, and supportive market conditions.
When traded with patience, proper confirmation, and disciplined risk management, the double bottom can offer high-quality trade setups with clearly defined entries, stop-loss levels, and profit targets. Like all chart patterns, it is not a guarantee of success, but when used within a broader trading plan and aligned with the higher-timeframe trend, it becomes a powerful tool for identifying trend reversals early rather than chasing them late.
Related Read: How to Identify and Trade the Adam and Eve Pattern
Frequently Asked Questions
How reliable is the double bottom pattern?
The double bottom pattern is considered reliable when it forms after a clear downtrend and is confirmed by a breakout above the neckline with strong volume. Its reliability drops significantly when traded without confirmation or during strong bearish market conditions.
What timeframe works best for trading a double bottom?
Double bottoms tend to be more reliable on higher timeframes such as the 4-hour, daily, and weekly charts. Lower timeframes can still work, but are more prone to false breakouts and noise.
Can a double bottom turn into a continuation pattern?
Yes. If the neckline fails to break and price rolls over, the pattern may simply represent consolidation within a larger downtrend rather than a true reversal.
Is volume required for a valid double bottom breakout?
While not mandatory, volume confirmation greatly increases the reliability of the pattern. A breakout without volume is more likely to fail or result in a false move.
What is the difference between a double bottom and a rounding bottom?
A double bottom forms two distinct lows at roughly the same level, while a rounding bottom develops gradually over time without clear separation between lows. Double bottoms provide clearer trade levels and confirmation points.
Can the double bottom pattern appear in crypto and forex markets?
Yes. The double bottom pattern works across stocks, forex, crypto, and indices, provided there is sufficient liquidity and volume to support price movement.
Should beginners trade the double bottom pattern?
Beginners can trade the double bottom pattern, but it's best to wait for confirmation and use conservative position sizing. Jumping in before the neckline breakout increases risk significantly.
What invalidates a double bottom pattern?
The pattern is invalidated if price breaks decisively below the support level formed by the two bottoms or fails to hold above the neckline after a breakout.
Follow Us On Social Media