

When you're day trading, timing is everything, and candlestick patterns are one of the quickest ways to understand what's happening in the market. This form of technical analysis, developed in Japan in the 18th century, helps traders and investors assess price movements and market sentiments before making a trade decision.
In this article, we'll walk through what candlestick day trading patterns are, how they work, the most common types to watch for, and how to use them smartly to improve your trading decisions.
What Are Candlestick Patterns?
Candlestick chart patterns are a kind of technical analysis developed in Japan in the 18th century, which helped traders and investors assess price movements and market sentiments.
It got into the western financial markets in the 20th century and was used to predict price movements before entering a trade.
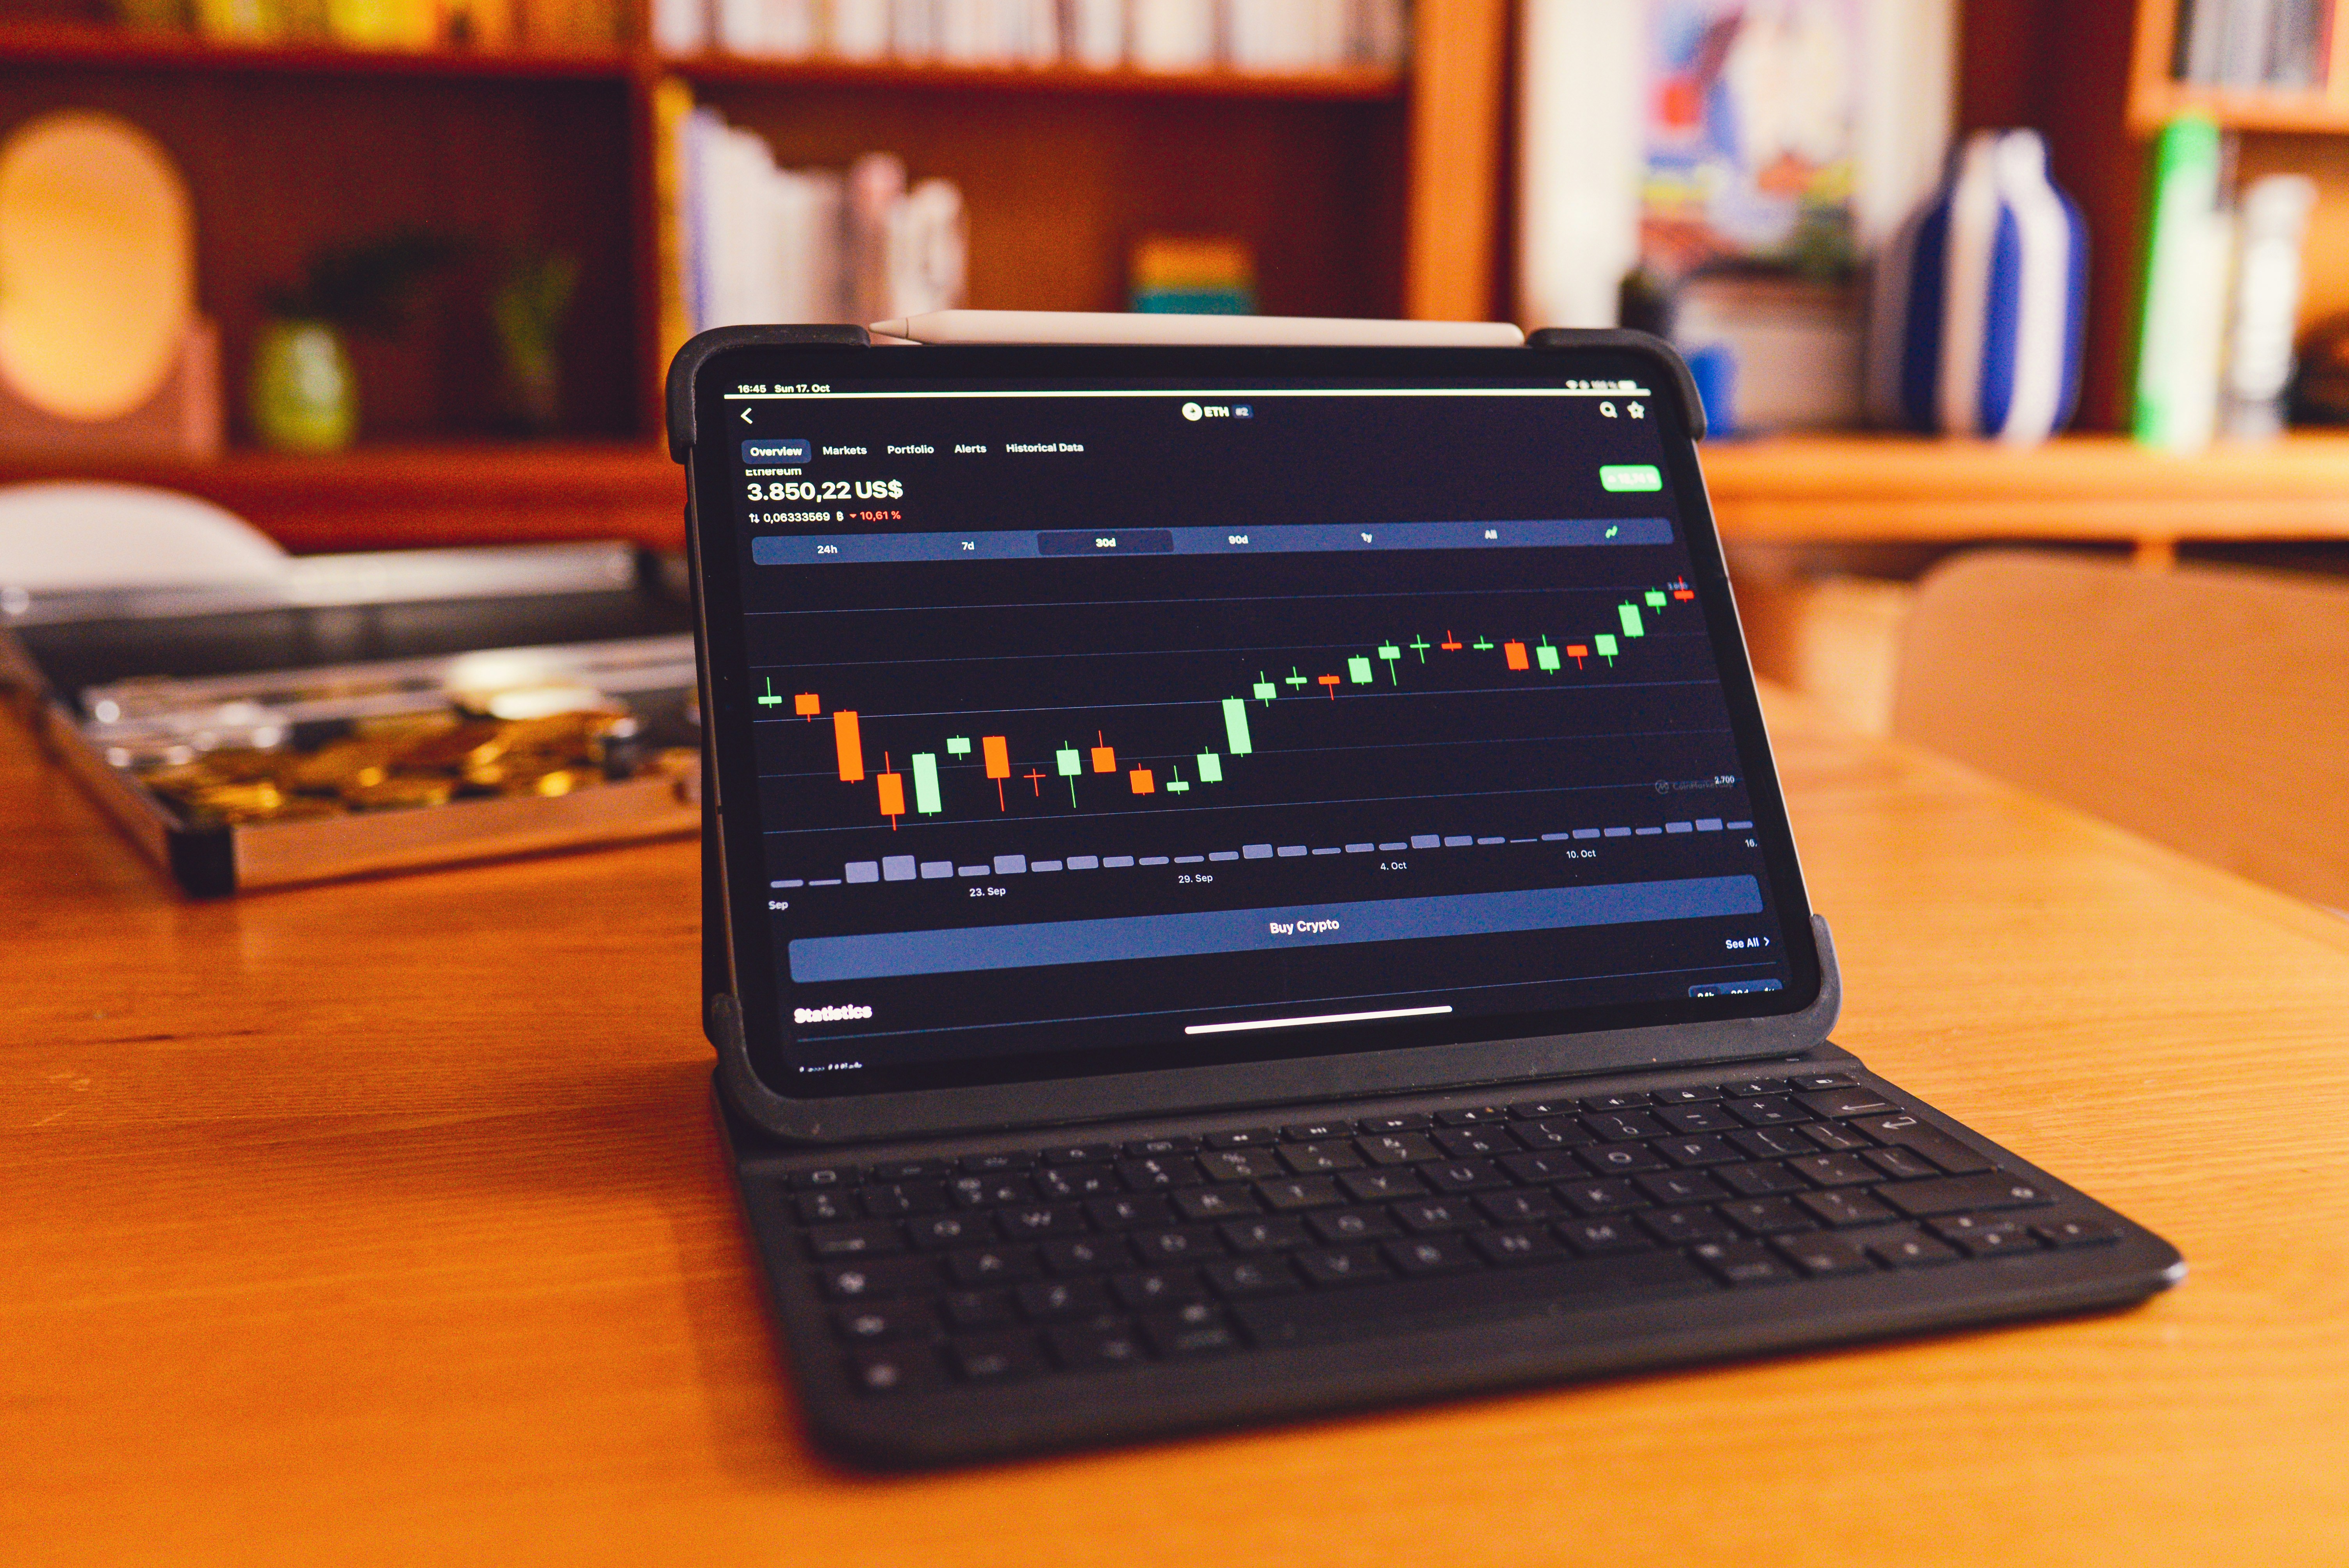
Candlestick patterns are price charts that show how an asset has moved within a specific time frame. Each "candle" tells a story through four main points: open, close, high, and low. Together, these candles form recognizable shapes called patterns that can signal whether a stock is about to rise, fall, or stall.
There are three components to take note of in the candlestick pattern:
The Body
The rectangular section showing the range between opening and closing prices. When the body is long, it indicates strong buying/selling pressure, while short bodies suggest indecision.
Shadows/Wick
This is an extension above/below the body on the charts. It marks the highest and lowest prices, and traders use this to gain insights into market volatility.
Color
The color is used to determine if the price is bullish or bearish. A bullish candlestick pattern is green or white, indicating the price closed higher than it opened, indicating upward momentum. Bearish is a red/black signal that the closing price is lower than the opening price, indicating a downward momentum.
How to Read Candlestick Patterns
There are four price points in the candlestick charts: open, high, low, and close.
- Open: The price at which the asset starts trading during the time period.
- High: The highest price reached, shown at the top of the upper shadow or the top of the body if no shadow.
- Low: The lowest price reached, shown at the bottom of the lower shadow (or the bottom of the body if no shadow).
- Close: The price at which the asset finishes trading during the time period.
There are bullish and bearish patterns in the candlestick charts. You will know the market is bullish if the closing price is higher than the opening price, and the candlestick is typically shown in green or white. But if the closing price is lower than the opening price, the candlestick is bearish, typically shown in red or black. These colors are what you will use to visually distinguish bullish from bearish candles at a glance.
Now, understanding what each candlestick represents is just the beginning. The real power of candlestick charts lies in the patterns they form over time, and that's where trading insights truly emerge. Candlestick patterns play a crucial role in day trading because they offer fast, visual cues that help traders navigate short-term price action with precision. These patterns allow traders to spot potential reversals before they occur, recognize trend continuations early, and gauge market sentiment whether it's driven by fear, greed, or uncertainty.
By translating chaotic price movements into clear, interpretable signals, candlesticks empower traders to make quicker, more confident decisions about when to enter or exit a trade. In essence, they serve as a visual map that transforms market noise into strategic insight.
Top Candlestick Day Trading Patterns You Should Know
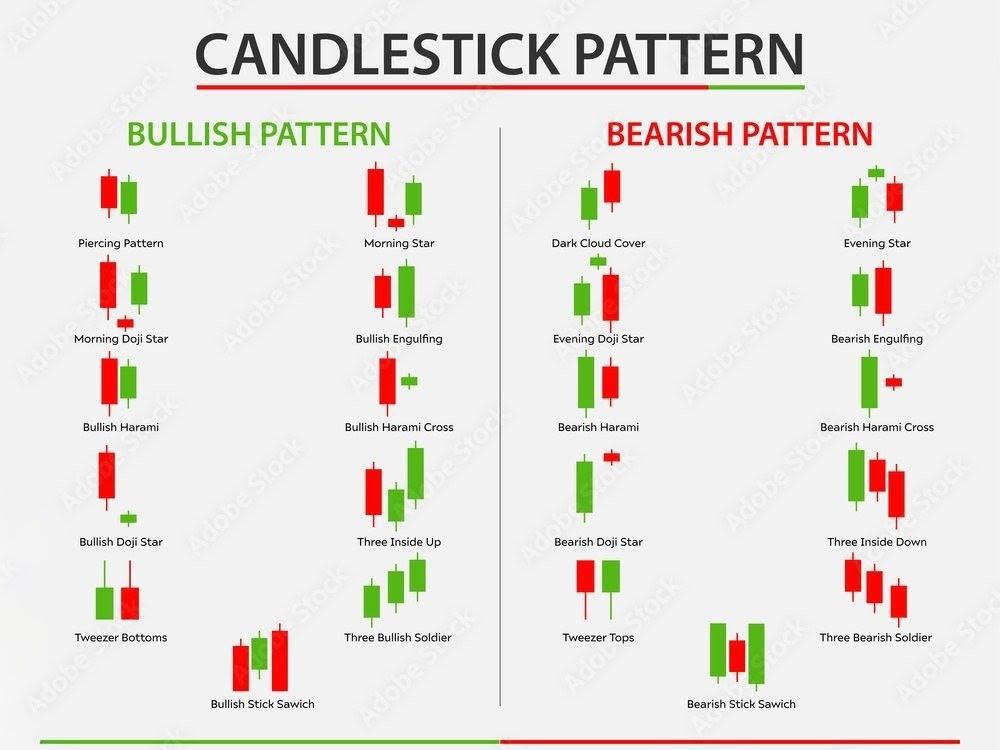
Let's break down some of the most common candlestick patterns used by day traders.
Bullish Candlestick Patterns
These patterns represent a buy signal.
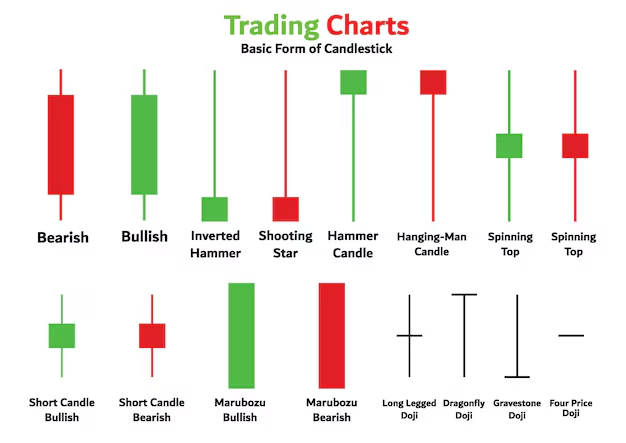
Hammer
The Hammer is one of the easiest bullish signals to recognize. It appears at the bottom of a downtrend and has a small body with a long lower wick, showing that sellers pushed prices down, but buyers fought back and closed near the top. This shift in control hints at a possible trend reversal. To trade using the Hammer candlestick pattern, first identify it at the bottom of a downtrend, as this signals potential reversal. Wait for confirmation with the next candle closing above the Hammer's high before entering a buy trade. Protect your position by placing a stop-loss just below the Hammer's wick, and set your take-profit target around the next key resistance level to lock in gains.
Bullish Engulfing
This pattern occurs when a strong green candle completely "engulfs" the previous red one. It tells you that buyers have overpowered sellers, signaling that momentum may be turning upward. It's most effective when it forms after a clear downward move, confirming renewed buying interest. To trade with the Bullish Engulfing candlestick pattern, look for it forming at the bottom of a downtrend, as this signals a potential shift in momentum. Wait for confirmation with the next candle closing above the engulfing candle's high before entering a buy trade. Place a stop-loss just below the engulfing candle's low for protection, and set your take-profit target near the next resistance level to secure profits.
Morning Star
The Morning Star is a three-candle formation that signals the end of a downtrend. The first candle is long and red, followed by a small indecisive one, and then a large green candle that confirms the reversal. It's a classic setup showing that selling pressure is fading and buyers are stepping back in. To trade using the Morning Star candlestick pattern, first identify it at the bottom of a downtrend, it signals that selling pressure is fading. Wait for a confirmation candle that closes above the pattern's high before entering a buy trade. Place your stop-loss below the lowest point of the formation (usually the second or first candle) to limit risk, and set your take-profit target near the next resistance level to lock in gains once the reversal takes hold.
Piercing Pattern
The Piercing Pattern starts with a red candle followed by a green candle that opens below the red's low but closes above its midpoint. It reflects a strong recovery within a single session, an early sign that bulls are regaining control and that an uptrend might be on the horizon.
Bearish Candlestick Patterns
Used to indicate a sell signal:
Shooting Star
The Shooting Star appears near the top of an uptrend and has a small body with a long upper wick. It shows that buyers pushed the price higher, but sellers quickly stepped in to drive it back down. This failed rally often signals the start of a bearish reversal, especially when confirmed at resistance. To trade using the Shooting Star candlestick pattern, spot it at the top of an uptrend, signaling that the bullish momentum may be fading. Wait for a confirmation candle that closes below the Shooting Star's low before entering a sell trade. Set your stop-loss just above the candle's wick to manage risk, and place your take-profit target near the next support level to capture potential downside as the market reverses.
Bearish Engulfing
The opposite of its bullish twin, the Bearish Engulfing forms when a large red candle completely swallows the previous green candle. It's a clear warning that sellers are taking charge, often marking the beginning of a downward move.
Evening Star
Think of this as the mirror image of the Morning Star. It starts with a big green candle, followed by a small indecisive one, and ends with a strong red candle. This pattern suggests that bullish momentum is weakening and sellers are ready to push prices lower. To trade using the Evening Star candlestick pattern, look for it at the top of an uptrend, a classic sign that bullish momentum is weakening. Wait for a confirmation candle that closes below the pattern's low before entering a sell trade. Place your stop-loss above the highest point of the formation to protect against false signals, and set your take-profit target near the next support level to secure profits as the trend reverses.
Hanging Man
The Hanging Man looks just like the Hammer but appears at the top of an uptrend. It shows that even though buyers managed to close the price higher, sellers were active during the session. When followed by a red candle, it often confirms that the uptrend may be losing strength.
Neutral / Indecision Candlestick Patterns
Neutral candlestick patterns are used to signal market indecision, when neither buyers nor sellers are clearly in control.
Doji
The Doji forms when the opening and closing prices are almost the same, leaving the candle looking like a simple cross. It's a classic sign of indecision; the market moved up and down but ended right where it started. Trading with the Doji candlestick pattern requires patience and context. First, identify a Doji and observe the surrounding trend along with key support or resistance levels. The setup only matters when it appears at a decisive point in the chart. Wait for confirmation; either a bullish signal for a Dragonfly Doji or a bearish one for a Gravestone Doji. Once confirmed, enter your trade in the direction of the new momentum. Place your stop-loss just beyond the Doji's wick to protect against sudden reversals, and aim for a take-profit target near the next support or resistance level. The Doji pattern suggests that momentum is stalling, and traders should watch closely for a possible breakout or reversal.
Spinning Top
The Spinning Top features a small body with long wicks on both sides, showing that prices swung both ways during the trading session. It represents a balanced tug-of-war between buyers and sellers; neither side can take control. This moment of hesitation often hints that the market is taking a breather before deciding its next move, whether that's continuing in the same direction or reversing completely.
Related Read: How to Trade Momentum Stocks
Conclusion
Candlestick patterns are one of the most reliable visual tools for day traders. They simplify price movements, reveal emotions in the market, and help you time entries and exits with more confidence.
However, remember that no pattern works 100% of the time. Use the candlestick patterns together with other technical tools and stay disciplined in your approach. The key is not just recognizing patterns, but knowing when to trust them and when to stay patient.
Learn 50+ Day Trading Terms Every Trader Should Know (Beginner-Friendly Guide) Here
Frequently Asked Questions
What are the most reliable candlestick patterns for day trading?
You can check out patterns like the Hammer and Doji. They are among the most reliable when confirmed with volume and trend direction.
Can beginners use candlestick patterns effectively?
Yes. They simplify price behavior, which is helpful to beginners because it visually simplifies price behavior. Start by learning a few key ones and practice spotting them.
Which time frame is best for day trading with candlesticks?
For day traders, the 1-minute to 15-minute charts work best, depending on your trading style and risk tolerance.
How many candlestick patterns should I memorize?
Focus on 8–10 key patterns. Quality over quantity! It's about understanding what they mean, not memorizing every shape.
Do candlestick patterns work in crypto or forex trading?
Absolutely. Candlestick patterns work across markets: stocks, forex, and crypto because they're all based on trader psychology and price action.
Follow Us On Social Media