Best Indicators for Cryptocurrency Trading: What Works and How to Use Them
Discover the best indicators for cryptocurrency trading in 2025. Learn how RSI, MACD, EMA, Fibonacci, and other top crypto indicators help traders make smarter decisions.

When trading cryptocurrency, especially if you are a day trader, you will notice that prices pump and dump within minutes, market sentiment shifts overnight, and liquidity can vanish in seconds. Due to this volatility, traders rely on technical indicators to identify better entry points, minimize losses, and trade with greater confidence.
But with hundreds of indicators available, which ones actually work for crypto? This guide breaks down the best indicators for cryptocurrency trading, explains why they matter, and shows you how to use them, whether you're day trading Bitcoin or swing trading altcoins.
What Are Crypto Trading Indicators?
Crypto trading indicators are mathematical tools used to analyze price movements, volume, trends, and volatility. They help traders answer important questions that guide their trading decisions. They use it to determine if the market is trending or ranging, if the price is about to reverse, if the coin is overbought or oversold, when to enter or exit a trade, amongst other things.
You should never rely on a single indicator. The most successful traders combine 2–3 complementary indicators for confirmation.
Read More: Day Trading Stocks vs. Forex vs. Crypto: Which Market Is Best
Best Indicators for Cryptocurrency Trading
Here are indicators that are best suited for crypto trading.
Moving Averages

Trading MA crossovers is one of the best indicators you could employ in crypto trading. This is a trend-following indicator that helps traders identify whether a crypto market is trending upward, trending downward, or simply ranging. They act as support and resistance levels, offering clearer insight into price direction.
A moving average is a lagging technical indicator; it combines the price points of a financial instrument over a specific timeline, dividing by the number of data points to give you a single trend line.
The most commonly used moving averages in crypto are the 50 EMA for short-term trends, the 100 EMA for medium-term trends, and the 200 EMA for long-term trends. Many traders prefer the EMA over the SMA because the EMA reacts faster to price changes, which is especially important in volatile markets like Bitcoin and altcoins. A simple trading approach is to view a price above the 50 EMA as bullish and a price below it as bearish.
Because moving averages are lagging indicators, they work by combining previous price data over a selected period and dividing it by the number of data points to create a single, smooth trend line. This helps traders filter out noise and reduce the impact of sudden price spikes while identifying potential support and resistance levels based on historical price behavior.
To effectively incorporate moving averages into a crypto trading strategy, traders must understand crossover signals. A crossover happens when the price moves above or below a moving average, suggesting a potential trend reversal. Some traders use price crossovers alone, while others apply two moving averages, one short-term and one long-term, to the same chart. When the short-term MA crosses above the long-term MA, it forms a golden cross, signaling a possible upward trend and potential buying opportunity. When the short-term MA crosses below the long-term MA, it forms a death cross, signaling a downward trend and a potential sell signal.
These crossovers are widely used in crypto because they provide simple, visual confirmation of changing market momentum.
Relative Strength Index

The Relative Strength Index (RSI) is a momentum-based technical indicator widely used by crypto traders to identify when a cryptocurrency is gaining strength or losing steam, as well as to spot overbought or oversold conditions.
An RSI reading above 70 typically signals that an asset may be overbought, suggesting a potential reversal to the downside, while a reading below 30 indicates that it may be oversold, pointing to a possible move upward. Traders often apply RSI in crypto by buying when the indicator dips below 30 and begins to rise again, and selling or taking profit when RSI moves above 70 and starts to decline. RSI becomes even more effective when combined with trend indicators like the EMA for confirmation.
The indicator itself is calculated by comparing profitable price closes to unprofitable ones using the formula: RSI = 100 – (100 / [1 + RS]), and it is displayed as a percentage out of 100. Lower values reflect oversold conditions, while higher values reflect overbought levels.
Beyond trend reversals, the RSI can also support trading decisions in range-bound markets by highlighting potential entry and exit points. Because the cryptocurrency market moves rapidly and is known for strong momentum shifts, the RSI is especially valuable as it helps traders identify exhaustion in price moves before a reversal occurs, making it one of the most effective momentum tools for navigating fast-changing crypto trends.
Moving Average Convergence Divergence
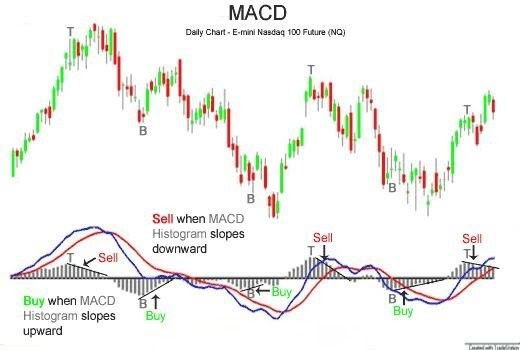
The Moving Average Convergence Divergence (MACD) is one of the most widely used indicators for spotting trend reversals and shifts in momentum in the cryptocurrency market.
With MACD, traders use two EMAs to understand overall trend direction; the strength of momentum behind price movements, and potential reversal points before they happen.
The MACD provides two major trading signals: a bullish crossover, which occurs when the MACD line crosses above the signal line and often indicates a potential buying opportunity, and a bearish crossover, where the MACD line dips below the signal line, signaling a potential sell.
Because crypto markets are highly volatile, MACD is especially effective on higher timeframes like the 4-hour and Daily charts, where trends are clearer and noise is reduced. Many traders rely on MACD to confirm trend changes, time entries, and avoid false breakouts, making it a powerful indicator for both beginners and advanced crypto traders.
Volume Profile
Volume Profile is a powerful volume-based indicator used to identify key price levels and liquidity zones in the market. It visually displays where most of the trading activity has taken place over a specific period, helping traders understand which price levels attracted the highest participation.
This is important because crypto prices tend to react strongly around certain areas: High Volume Nodes (HVN) often act as major support or resistance zones since they represent areas where buyers and sellers heavily interact, while Low Volume Nodes (LVN) usually lead to quicker price movements due to lower trading interest in those regions.
For traders, Volume Profile is especially useful for identifying reliable support and resistance levels when scalping, day trading, or swing trading. Highlighting where market participants are most engaged helps pinpoint high-probability entry and exit points across different timeframes.
Bollinger Bands
Another important indicator that crypto traders utilize is the Bollinger band indicator, great for analyzing volatility and predicting potential breakouts in the crypto market.
The bands expand when volatility increases and contract when the market becomes quiet, making them an ideal tool for spotting upcoming price movements. When the bands squeeze tightly together, it often signals that a major breakout is approaching.
Traders also use the upper and lower bands to identify overbought or oversold conditions: price touching or breaking above the upper band typically indicates overbought levels, while touching or falling below the lower band suggests oversold conditions. In crypto, this helps traders anticipate reversals before they happen.
Beyond volatility analysis, Bollinger Bands are useful for trend identification. If the middle band (which is a moving average) slopes upward, it points to a bullish trend, while a downward slope suggests bearish momentum. The width of the bands provides insight into market activity: narrow bands signal low volatility and the potential for a sharp move, known as a "squeeze," while wider bands reflect high volatility.
Traders also use Bollinger Bands to set price targets; for example, if the price bounces off the lower band, the upper band becomes a potential target, and vice versa. When combined with RSI, Bollinger Bands become even more powerful for timing entries and exits, especially in fast-moving crypto markets.
Dollar Cost Strategy
If you're looking for a crypto trading strategy that doesn't rely on technical indicators, Dollar Cost Averaging (DCA) is worth considering. It's a simple yet effective approach used by both beginners and experienced traders.
Instead of investing all your money into a cryptocurrency at once, DCA involves breaking your investment into smaller portions and spreading them out over a set period of time. You invest the same amount at regular intervals, say, on a specific day and time each week, regardless of the market price.
For example, if you decide to invest in Ethereum with DCA with a $10,000 budget. Instead of buying all at once, you spread it across 10 months. Ten months equals about 40 weeks. Divide $10,000 by 40, that's $250 per week. So every Friday at 6 p.m., you invest $250 into ETH until the full $10,000 is used. By the end of 10 months, you'll have accumulated ETH steadily without stressing over short-term fluctuations.
DCA reduces the impact of market volatility. By buying at different price points over time, you avoid the risk of investing everything at a single high price. Over the long run, this often results in a better average purchase price compared to a one-time lump sum investment. And you don't have to worry about timing the market or reacting to sudden price swings.
To apply this strategy effectively, you'll need to trade the cryptocurrency directly through an exchange. Brokers typically don't support the recurring purchase structure required for DCA.
Volume-Weighted Average Price
VWAP is a volume-based indicator that calculates the average price of a crypto asset throughout the day, weighted by trading volume, giving traders a more accurate picture of the asset's true intraday value.
To Read VWAP:
Price above VWAP → bullish sentiment (buyers are in control)
Price below VWAP → bearish sentiment (sellers are dominating)
VWAP helps traders spot genuine moves by filtering out noise and avoiding fake breakouts or manipulated price spikes. It acts as a dynamic support/resistance level, making it extremely useful for entries, exits, and understanding intraday market flow.
Stochastic Oscillator
The Stochastic Oscillator is a momentum indicator that compares a cryptocurrency's closing price to its price range over a specific period. It's similar to the Relative Strength Index (RSI), but generally more sensitive to short-term price movements.
It is used to identify potential reversal signals; A signal above 80 indicates it is overbought, and the price may be due for a pullback. While below 20 indicates an oversold trade, and price may be due for a bounce.
This tool is popular among crypto scalpers who trade on lower timeframes (5–15 minutes) as it helps spot quick reversal opportunities in volatile markets.
The Stochastic Oscillator is a fast-reacting momentum tool that shines when you need to catch short-term reversals, especially in scalping strategies.
These indicators are very effective; for Day Trading, we recommend the RSI + VWAP + Bollinger Bands combination. Or go for EMA (50 + 200) + MACD. If you are a swing trader, the 50 EMA + MACD combination is best suited for you.
How to Choose the Right Crypto Indicators
Before choosing an indicator to work with when trading crypto, keep these few tips in mind.
- Pick indicators that match your trading style. Scalpers need fast signals; swing traders need slower confirmation.
- Avoid using indicators that say the same thing. Combining RSI + Stochastic is basically the same thing and is redundant to your strategy.
- Use no more than 2–3 indicators, as too many indicators may bring you confusion. Unless you are a pro trader who can pull this off, it's better to stick to a few indicators.
- Do not use indicators without understanding them first. Some traders only rely on indicators alone without market structure or other strategies.
- Despite the indicator you are using, remember to factor in risk management in your trades.
Conclusion
With thousands of cryptocurrencies and rapid market volatility, having the right technical indicators is essential for making better trading decisions.
Whether you're a beginner or an active trader, tools like RSI, EMA, MACD, Bollinger Bands, and VWAP help you analyze trends, predict reversals, and spot trading opportunities with more confidence.
The key is not using all indicators at once, but combining 2–3 strong, complementary indicators to build a strategy that fits your trading style. Master these indicators, apply strict risk management, and you'll trade crypto with more precision and consistency in 2025.
Read More: Candlestick Day Trading Patterns: How to Read and Trade Like a Pro
Frequently Asked Questions
What is the single best indicator for cryptocurrency trading?
▼
There is no single "best" indicator for all crypto traders, because each one serves a different purpose. However, the MA (Moving Average) and RSI are the most widely trusted because they work well across all timeframes and market conditions. Most professionals combine EMA + RSI or EMA + MACD.
Which indicator is best for crypto day trading?
▼
For fast day trading decisions when navigating the crypto market, the top indicators are: VWAP (intraday trend + support/resistance), Bollinger Bands (volatility + breakout signals), and RSI (momentum + entry timing). A proven combination is RSI + VWAP + Bollinger Bands.
Which indicator is best for swing trading crypto?
▼
Swing traders use slower, more reliable indicators such as 50 MA or 100 MA (trend direction) or MACD (momentum + reversals). The most popular combo is 50 EMA + MACD.
Are indicators enough to trade crypto successfully?
▼
No. Indicators are tools, not a full strategy. You still need to define your market structure, risk management, a good entry/exit plan, and add patience when trading. Indicators are tools to improve your accuracy, but don't guarantee profit.
Is it bad to use too many indicators?
▼
Yes. Using more than 2–3 indicators causes conflicting signals and slows decision-making. It is best to use simple, complementary indicators.
What indicator predicts crypto breakouts?
▼
The best breakout indicators to master in this case include: Bollinger Band Squeeze, Volume spikes, MACD crossover, and VWAP reclaim. Combining a Bollinger Band squeeze + rising volume is a powerful breakout signal.
Is RSI reliable in crypto trading?
▼
RSI performs extremely well in crypto because crypto markets experience strong momentum swings. However, RSI works best when used with trend confirmation indicators like EMA or MACD.
What indicators help avoid fake breakouts in crypto?
▼
To filter fakeouts, traders use: VWAP, Volume Profile, MACD, and Bollinger Bands. A breakout with strong volume above VWAP is usually real.
What is the best indicator for beginners?
▼
Beginners should start with: RSI, 50 EMA, and MACD. They are simple, visual, and have strong accuracy.
What indicator works best for Bitcoin specifically?
▼
Bitcoin responds extremely well to: 200 EMA (long-term trend), 50 EMA (medium trend), RSI, and Bollinger Bands. Many Bitcoin traders consider the 200 EMA one of the strongest indicators in crypto.
Cryptocurrency Trading Technical Indicators Crypto Trading RSI MACD Moving Averages Trading Strategy Technical Analysis
Frequently Asked Questions
What is the single best indicator for cryptocurrency trading?
There is no single "best" indicator for all crypto traders, because each one serves a different purpose. However, the MA (Moving Average) and RSI are the most widely trusted because they work well across all timeframes and market conditions. Most professionals combine EMA + RSI or EMA + MACD.
Which indicator is best for crypto day trading?
For fast day trading decisions when navigating the crypto market, the top indicators are: VWAP (intraday trend + support/resistance), Bollinger Bands (volatility + breakout signals), and RSI (momentum + entry timing). A proven combination is RSI + VWAP + Bollinger Bands.
Which indicator is best for swing trading crypto?
Swing traders use slower, more reliable indicators such as 50 MA or 100 MA (trend direction) or MACD (momentum + reversals). The most popular combo is 50 EMA + MACD.
Are indicators enough to trade crypto successfully?
No. Indicators are tools, not a full strategy. You still need to define your market structure, risk management, a good entry/exit plan, and add patience when trading. Indicators are tools to improve your accuracy, but don't guarantee profit.
Is it bad to use too many indicators?
Yes. Using more than 2–3 indicators causes conflicting signals and slows decision-making. It is best to use simple, complementary indicators.
What indicator predicts crypto breakouts?
The best breakout indicators to master in this case include: Bollinger Band Squeeze, Volume spikes, MACD crossover, and VWAP reclaim. Combining a Bollinger Band squeeze + rising volume is a powerful breakout signal.
Is RSI reliable in crypto trading?
RSI performs extremely well in crypto because crypto markets experience strong momentum swings. However, RSI works best when used with trend confirmation indicators like EMA or MACD.
What indicators help avoid fake breakouts in crypto?
To filter fakeouts, traders use: VWAP, Volume Profile, MACD, and Bollinger Bands. A breakout with strong volume above VWAP is usually real.
What is the best indicator for beginners?
Beginners should start with: RSI, 50 EMA, and MACD. They are simple, visual, and have strong accuracy.
What indicator works best for Bitcoin specifically?
Bitcoin responds extremely well to: 200 EMA (long-term trend), 50 EMA (medium trend), RSI, and Bollinger Bands. Many Bitcoin traders consider the 200 EMA one of the strongest indicators in crypto.