


The Adam and Eve pattern is a rare pattern combination made up of a double top or a double bottom formation on the charts. Traders trust it as a bullish reversal signal because it tells a clear story about sellers losing control and buyers slowly stepping in. Overall, it is a helpful chart pattern for traders and investors to find suitable trading signals before committing to a trade.
Let's break it down in a practical, trader-friendly way.
What Is the Adam and Eve Pattern?
The Adam and Eve pattern is a bullish reversal chart pattern that signals a potential shift from a downtrend to an uptrend. It was founded by Thomas Bulkowski, who first mentioned it in his book, "Encyclopedia of Chart Patterns", and has been widely adopted by traders globally.
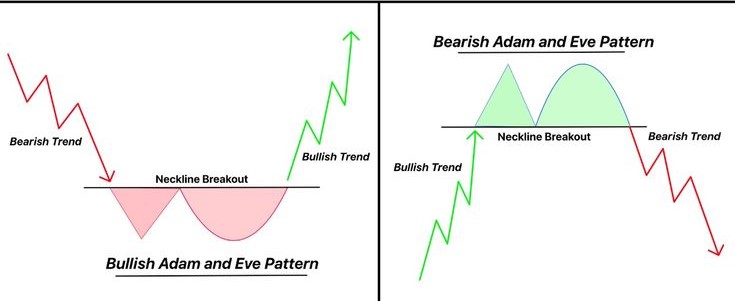
The Adam and Eve pattern is a variation of the classic double bottom, but with one key difference: the two bottoms are not the same shape.
The first bottom, referred to as Adam, is sharp, narrow, and V-shaped, signifying an aggressive and emotional.
The second bottom, Eve, is smooth, rounded, U-shaped, and controlled
Together, they become a powerful signal signifying that a trend may be ending and a reversal is likely to follow. It clearly indicates a bullish reversal, but when it appears at the top, it signals a bearish reversal.
How the Adam and Eve Pattern Forms
There are different phases of the Adam and Eve chart pattern:
- Strong prior trend: The Adam and Eve pattern begins after a clear trend. A downtrend leads to a potential double bottom, while an uptrend sets up a possible double top.
- Adam formation (sharp move): Then comes the Adam formation, caused by the price making a fast, steep move in one direction and quickly reversing. This sharp action reflects strong emotion and panic in the market.
- Quick rebound: After the Adam move, the price bounces back, but the trend is not fully reversed yet.
- Eve formation (rounded move): Price returns to the same area more slowly, forming a rounded bottom or top. This shows hesitation and weakening momentum.
- Neckline forms: A horizontal support or resistance level develops, connecting the highs or lows between the Adam and Eve structures.
- Breakout above or below the neckline: Price breaks through the neckline, often with increased volume. This move signals a shift in control.
- Confirmation and entry: The breakout confirms the Adam and Eve pattern. Traders typically enter after confirmation, since the pattern is not valid without the breakout.
Best Indicators to Confirm the Adam and Eve Pattern
The Adam and Eve pattern works best when it's supported by additional tools rather than used on its own. These indicators help confirm the setup and improve trade confidence.
- Trendlines: Use trendlines to clearly mark the neckline and identify any descending or ascending trendlines. A break of both the neckline and a trendline strengthens the signal.
- Volume indicators: Volume should increase during the breakout. Rising volume confirms strong participation and suggests the move is more likely to continue.
- Candlestick analysis: Candlestick patterns help validate the structure of the Adam and Eve formation. Strong rejection wicks, solid breakout candles, or momentum candles add confirmation.
- Support and resistance levels: Identifying key support and resistance provides context and confluence. A breakout aligned with major levels is more reliable.
- RSI (Relative Strength Index): Bullish divergence during the Eve bottom (or bearish divergence during a top) strengthens the reversal signal and shows weakening momentum in the prior trend.
- Moving averages: A breakout above short-term moving averages adds confidence that momentum is shifting in favor of the reversal.
Remember, indicators should support price action, not replace it. Price is always the primary signal, and indicators work best as confirmation tools.
Read More: How to Trade Momentum Stocks: Strategies, Indicators & Risk Management
How to Trade the Adam and Eve Pattern

The Adam and Eve pattern is simple to recognize, but successful trading comes down to execution, patience, and risk management. Many traders fail not because the pattern doesn't work, but because they enter too early or manage risk poorly.
Here are strategies to trade this pattern successfully:
Entry Strategy: Wait for Confirmation
The safest way to trade the Adam and Eve pattern is to wait for a confirmed breakout at the neckline. This helps filter out false moves and improves trade quality.
What Confirmation Looks Like:
- A strong candle close above the neckline (for bottoms) or below it (for tops)
- Increased volume during the breakout
- No immediate rejection back inside the range
Aggressive traders may enter earlier during the Eve formation, but beginners and intermediate traders are better served by waiting for confirmation.
Stop-Loss Placement: Protect Capital First
Proper stop-loss placement is what makes this pattern sustainable over time. A common Stop-Loss approach is to place stop loss below the Eve bottom (most conservative for Adam and Eve bottoms) or below the neckline after a successful retest (moderate risk).
For Adam and Eve tops, the same logic applies in reverse: place the stop-loss above the Eve peak.
Avoid placing stops too tightly. The Eve structure is rounded by nature, and price often needs room to fluctuate before continuing.
Profit Targets
Profit targets can be kept simple by using a practical method based on pattern projection. To set targets, traders measure the distance from the Eve bottom (or top) to the neckline and then project that same distance from the breakout point.
However, these targets should always be adjusted in consideration of nearby support or resistance levels, overall market conditions, and the volume behavior following the breakout. This approach ensures that profit-taking remains realistic and aligned with the broader trading environment.
Trading the Adam and Eve Bottom (Bullish Setup)
After identifying a valid Adam and Eve bottom, traders typically:
- Wait for the price to break and close above the neckline.
- Enter a long position after confirmation.
- Place a stop-loss below the Eve bottom
- Target a move equal to the height of the pattern
This approach often creates a favorable risk-to-reward setup, especially in recovering or trending markets.
Trading the Adam and Eve Top (Bearish Setup)
The Adam and Eve top is the bearish version of the pattern and appears after an uptrend.
How It Forms:
- The Adam top is a sharp upward spike
- The Eve top forms a rounded, slower peak
- The neckline is drawn through the low between the two tops
To trade this pattern, wait for a break and close below the neckline. Then enter a short position after confirmation. Place your stop-loss above the Eve peak. This setup is useful for identifying potential reversals in overheated markets.
Read More: Cup and Handle Pattern: How It Works and How to Trade It (2026 Guide)
Benefits and Limitations of the Adam and Eve Pattern
Like all chart patterns, the Adam and Eve pattern has strengths and weaknesses. Understanding both helps traders use it responsibly and avoid unrealistic expectations.
Benefits:
- Clear reversal structure: The pattern provides a well-defined bullish or bearish reversal setup once the neckline is broken and confirmed.
- Easy to visually identify: The contrast between the sharp Adam move and the rounded Eve formation makes the pattern relatively easy to spot, even for less experienced traders.
- Strong psychological foundation: The pattern reflects a shift from emotional, aggressive trading (Adam) to hesitation and weakening momentum (Eve), followed by a change in market control.
- Works across multiple markets: The Adam and Eve pattern can appear in stocks, crypto, forex, and indices, as long as sufficient liquidity and volume are present.
- Pairs well with other indicators: It is easy to build confluence using volume, RSI divergence, moving averages, and trendlines, which strengthens trade confirmation.
- Provides clear trade structure: The pattern offers logical areas for entries, stop-loss placement, and profit targets, helping traders stay disciplined.
- Boosts trader confidence when confirmed: A clean neckline breakout with volume often gives traders more confidence to stay with the trade rather than exiting too early.
Limitations:
- Requires patience and discipline: The pattern takes time to fully develop. Entering before confirmation increases the risk of false signals.
- False breakouts still occur: Even well-formed Adam and Eve patterns can fail, especially if volume does not support the breakout.
- Less reliable in strong trending markets: In powerful bear or bull markets, the price may continue in the original direction instead of reversing.
- Needs confirmation from other tools: The pattern should not be traded in isolation. Without volume, trend context, or momentum confirmation, reliability decreases.
- Struggles in low-volume environments: In thin or low-liquidity markets, the pattern is more prone to whipsaws and failed breakouts.
- Not a guarantee of success: No chart pattern offers 100% certainty. Risk management remains essential, even when the setup looks ideal.
One of the most common mistakes traders make with the Adam and Eve pattern is entering too early, before a confirmed breakout occurs, even though the pattern isn't valid until resistance or support is clearly broken. Many traders also ignore volume, which is critical, as low-volume breakouts tend to fail more often. Another frequent error is treating any double bottom or double top as an Adam and Eve pattern, when in reality the shape and underlying psychology are what make the setup meaningful. Trading the pattern against a strong higher-timeframe trend is another pitfall, since even a clean bullish formation can fail inside a dominant downtrend. This is why patience matters.
The Adam and Eve pattern works best as a confirmation-based reversal setup, not a standalone signal. When combined with proper volume analysis, broader trend context, and disciplined risk management, it can become a valuable tool, but it should never replace a complete trading plan.
Conclusion
The Adam and Eve pattern is not just another chart formation; it's a visual representation of changing market psychology. The sharp, emotional move that forms Adam reflects panic or exhaustion, while the rounded Eve structure shows hesitation, balance, and a gradual transfer of control. When the price finally breaks the neckline, it confirms that the prior trend has truly weakened and a new phase is beginning.
However, the real edge doesn't come from spotting the pattern alone. It comes from waiting for confirmation, respecting volume, and managing risk with discipline. Traders who treat the Adam and Eve pattern as a confirmation-based reversal tool, rather than a prediction, tend to extract the most value from it. When combined with trend context, key levels, and momentum indicators, it can offer high-quality setups across multiple markets.
Used patiently and responsibly, the Adam and Eve pattern becomes less about chasing reversals and more about aligning with a genuine shift in market control, which is where consistent trading performance is built.
Read more: Head and Shoulders Chart Pattern: How to Trade (2026 Guide)
Frequently Asked Questions
Is the Adam and Eve pattern bullish or bearish?
The Adam and Eve pattern is primarily a bullish reversal pattern when it appears as a double bottom after a downtrend. However, it also has a bearish counterpart (the Adam and Eve top), which signals a potential reversal from an uptrend to a downtrend once the neckline is broken.
What timeframe works best for the Adam and Eve pattern?
The Adam and Eve pattern works best on higher timeframes such as the 4-hour, daily, and weekly charts. On lower timeframes, the pattern can appear frequently but tends to produce more false breakouts due to market noise and lower volume reliability.
How reliable is the Adam and Eve pattern?
The Adam and Eve pattern is considered moderately to highly reliable when properly confirmed with volume and broader trend context. Its reliability decreases significantly when traded without confirmation or in strong trending markets where reversals are less likely.
Can beginners trade the Adam and Eve pattern?
Yes, beginners can trade the Adam and Eve pattern, but only if they wait for confirmation at the neckline. Early entries during the Eve formation increase risk and often lead to losses. Beginners should focus on confirmation-based entries and strict stop-loss placement.
What is the difference between Adam and Eve and a regular double bottom?
The key difference lies in structure and psychology. A standard double bottom usually has two similar-shaped lows, while the Adam and Eve pattern combines a sharp V-shaped bottom (Adam) with a rounded U-shaped bottom (Eve). This contrast reflects a transition from emotional selling to controlled accumulation.
Does the Adam and Eve pattern work in crypto and forex?
Yes. The Adam and Eve pattern works in stocks, crypto, forex, and indices, provided there is sufficient liquidity and volume. It tends to perform better in markets with active participation and clear trend structure.
Should volume always increase on the breakout?
Ideally, yes. Rising volume on the neckline breakout strengthens the validity of the Adam and Eve pattern. Low-volume breakouts are more likely to fail or result in false moves.
Can the Adam and Eve pattern fail?
Absolutely. Like all chart patterns, it can fail due to false breakouts, lack of volume, or strong higher-timeframe trends overriding the setup. This is why risk management and confirmation are essential.
Follow Us On Social Media