


What Is the Rounding Bottom Pattern?
The rounding bottom pattern is a bullish reversal chart pattern that forms after a prolonged downtrend. It appears as a smooth U-shaped structure and signals a gradual shift from selling pressure to buyer accumulation, often leading to a breakout and trend reversal.
The rounding bottom pattern is quite different; instead of forming a sharp V-shaped bottom, price action curves gently, creating a smooth U-shaped structure on the chart that signifies a reversal in long-term price movements.
This structure illustrates how sellers initially dominate and push the price lower. Over time, selling pressure weakens. Buyers begin to accumulate quietly, volatility subsides, and prices stabilize. Eventually, demand outweighs supply, leading to a breakout above resistance and a potential trend reversal.
Unlike aggressive reversal patterns, the rounding bottom is slow and deliberate; it can take weeks to months and is considered a rare occurrence in the market.
How to Identify the Rounding Bottom Pattern
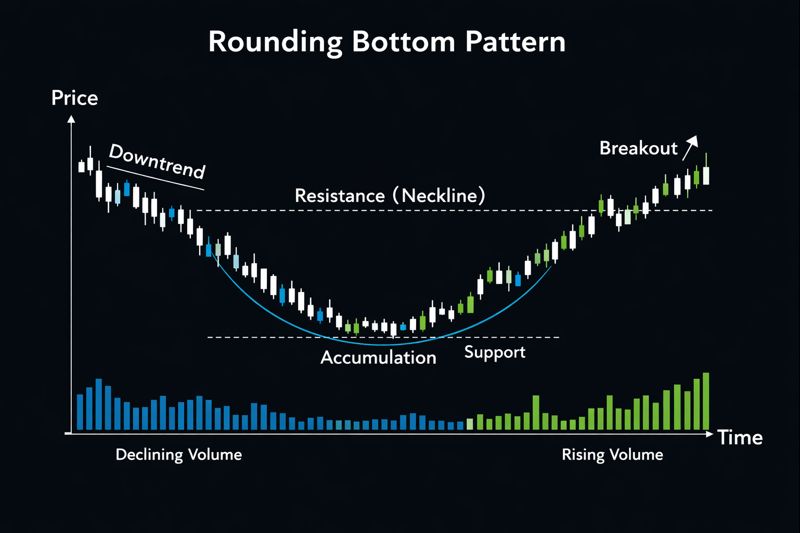
A rounding bottom pattern usually develops after a long-term decline in price. During this phase, the stock experiences steady selling pressure, pushing prices lower over time. This extended downtrend creates the foundation for the pattern to form.
As the decline continues, the selling momentum begins to slow down. Instead of sharp drops, the price starts to move sideways and forms a smooth, curved bottom. This "U-shaped" structure signals that sellers are losing control and the market is starting to stabilise.
Next, watch for a gradual price increase that mirrors the left side of the pattern. The rise should be slow and steady rather than explosive. This symmetry is important as it shows a gradual shift in sentiment as buyers slowly step back into the market.
Finally, the pattern gains confirmation when trading volume increases during the price rise. Higher volume indicates stronger buyer participation and adds confidence that the rounding bottom could lead to a bullish reversal.
The Psychology Behind the Rounding Bottom Pattern
Understanding the psychology behind the rounding bottom pattern is what separates recognising a chart shape from trading it with confidence. In real market conditions, this pattern is not driven by panic or emotional buying. Instead, it reflects a measured transition where selling pressure is absorbed, and accumulation quietly takes place, with volume confirming each stage of the shift.
What typically happens in the market:
- Early phase: Sellers are still in control, but downside momentum begins to slow, a common sign that aggressive selling is losing effectiveness
- Middle phase: Fear gradually fades, trading volume dries up, and price starts to stabilise as the market finds acceptance at lower levels
- Late phase: Buyers begin to accumulate patiently while sellers lose conviction and exit positions with less urgency
- Breakout phase: New demand enters, volume expands, and price moves higher, confirming the bullish reversal
By the time the breakout occurs, most of the selling pressure has already been absorbed. In practice, experienced traders are not chasing price at this stage; they have already identified the base and are focused on confirmation. This is why rounding bottom breakouts often lead to more sustained trends instead of sharp, emotional spikes.
This also explains why the pattern takes time to form. Markets do not reverse instantly. They transition as supply weakens and demand gradually takes control. Recognising these real-world behaviours helps traders trade the pattern with patience rather than anticipation.
Rounding Bottom vs Rounding Top
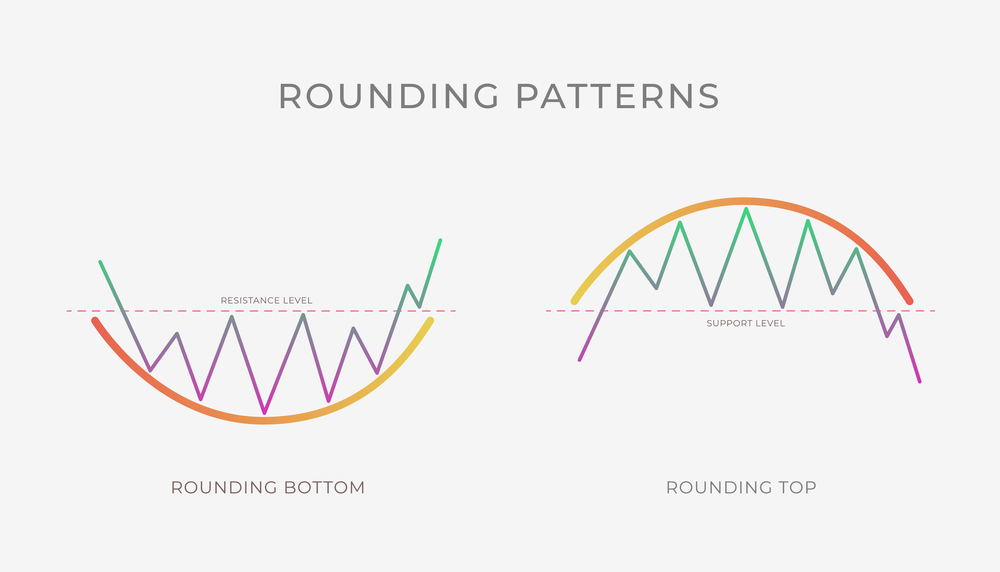
The rounding bottom is the bullish counterpart to the rounding top pattern. While they appear visually similar, the direction of price and volume behaviour separates accumulation from distribution.
Rounding Bottom:
- Signals a shift from bearish to bullish market conditions
- Selling pressure gradually fades as price stabilises
- Volume typically declines during the base, showing reduced selling interest
- Volume increases as price breaks above resistance, confirming buyer participation
- Represents accumulation, where buyers quietly build positions over time
Rounding Top:
- Signals a shift from bullish to bearish market conditions
- Buying momentum slows as price struggles to push higher
- Volume often contracts near the top, indicating weakening demand
- Volume expands on the breakdown below support, confirming selling pressure
- Represents a distribution, where larger players exit positions gradually
Both patterns reflect gradual market transitions, not emotional or panic-driven reversals. Volume is the key confirmation tool as it reveals whether participation is building or fading, helping traders distinguish between a true reversal and a temporary pause.
Related Read: Rounding Top Pattern: How to Identify and Trade This Bearish Reversal
How to Trade the Rounding Bottom Pattern

It does not end at studying the charts, but also knowing how to trade this pattern to maximize profits. The rounding bottom is a patience-based setup. In real market conditions, premature entries are one of the most common reasons traders get trapped inside the base. Experienced traders focus on confirmation rather than anticipation, allowing the market to prove that the transition from selling to buying is underway.
Entry Strategy: Wait for Confirmed Strength
From a risk-management standpoint, the highest-quality entries occur after the breakout is confirmed. Key conditions to look for include:
- A clear and sustained close above resistance, not just an intraday push
- Expansion in volume, showing genuine participation rather than short covering
- Price holding above the former range without an immediate rejection
Some traders prefer to enter on a retest of resistance as support following the breakout. While this approach may result in fewer trades, it often provides better risk-to-reward and helps filter out weaker setups.
Before entering a rounding bottom breakout, use our risk-reward calculator to confirm the trade makes sense.
Stop-Loss Placement
Stop placement should respect the structure of the pattern rather than rely on tight, arbitrary levels. Common, structurally sound locations include:
- Below the most recent swing low
- Below the midpoint of the rounded base
- Below the breakout retest level, if a pullback occurs
Tight stops are a frequent cause of avoidable losses in this pattern. Because rounding bottoms develop gradually, the price often needs room to fluctuate before the trend fully establishes itself.
Profit Targets
A disciplined way to project targets is to:
- Measure the vertical depth of the rounded base
- Project that distance upward from the breakout level
Targets should always be adjusted based on nearby resistance zones, overall market context, and prevailing volatility. Experienced traders remain flexible rather than treating targets as fixed outcomes.
Watch the video breakdown below for a live chart example
Indicators That Add Confirmation
Indicators should reinforce price action, not override it. When used correctly, they provide additional confidence in the setup:
- Volume: Expansion on the breakout is critical for confirmation
- RSI: Bullish divergence during the formation supports a shift in momentum
- Moving Averages: Reclaiming key averages signals improving trend strength
- Trendlines: A clean break of descending trendlines adds technical confluence
From an analytical perspective, the strongest rounding bottom setups occur when price, volume, and structure align. Indicators are most effective when they support what the chart is already communicating.
Read More: Support and Resistance Explained: How Smart Traders Use Them to Boost Profits
Pros and Cons of the Rounding Bottom Pattern
Pros:
- Strong bullish reversal structure
- Reflects accumulation and sentiment shift
- Works across stocks, crypto, forex, and indices
- Offers clear breakout and risk levels
- Pairs well with volume and momentum indicators
Cons:
- Takes time to form
- Requires discipline and patience
- Can fail without volume confirmation
- Less effective in strong bear markets
Conclusion
The rounding bottom pattern reflects a slow shift in market control, where selling pressure is gradually absorbed, and buyers step in with patience, strategy, and trade confirmed reversals. From my own trading experience, rounding bottoms tend to perform best after extended consolidation phases rather than sharp sell-offs.
The strongest setups develop over time, with price stabilising, volume behaviour shifting, and resistance breaking with genuine participation. Traders who wait for confirmation improve their odds, while early entries often get trapped inside the base.
When aligned with proper structure, volume, and risk management, the rounding bottom becomes a reliable framework for sustainable trend reversals rather than short-term price spikes.
Read More: 15 Proven DayTrading Strategies For A Profitable Trade
Frequently Asked Questions
Is the rounding bottom pattern bullish?
Yes. The rounding bottom pattern is a bullish reversal pattern that signals a gradual shift from selling pressure to buying momentum. It suggests accumulation is taking place and often leads to an upward trend once the price breaks above resistance with volume.
How reliable is the rounding bottom pattern?
The rounding bottom pattern is moderately to highly reliable when confirmed properly. Reliability increases when the breakout occurs with strong volume and aligns with bullish indicators such as RSI divergence or moving average support.
What timeframe is best for trading rounding bottoms?
Rounding bottom patterns work best on higher timeframes, especially the daily and weekly charts. These timeframes reflect long-term accumulation and provide stronger, more sustainable reversal signals than lower intraday charts.
Can beginners trade the rounding bottom pattern?
Yes. Beginners can trade the rounding bottom pattern because it forms slowly and offers clear breakout-based entries. The key is waiting for confirmation above resistance and using proper risk management rather than entering early.
What is the difference between a rounding bottom and a double bottom?
A rounding bottom forms gradually with a smooth U-shape and reflects long-term accumulation, while a double bottom forms faster with a W-shape and signals a short-term rejection of lower prices. Both are bullish, but rounding bottoms tend to produce more stable trend reversals.
Follow Us On Social Media